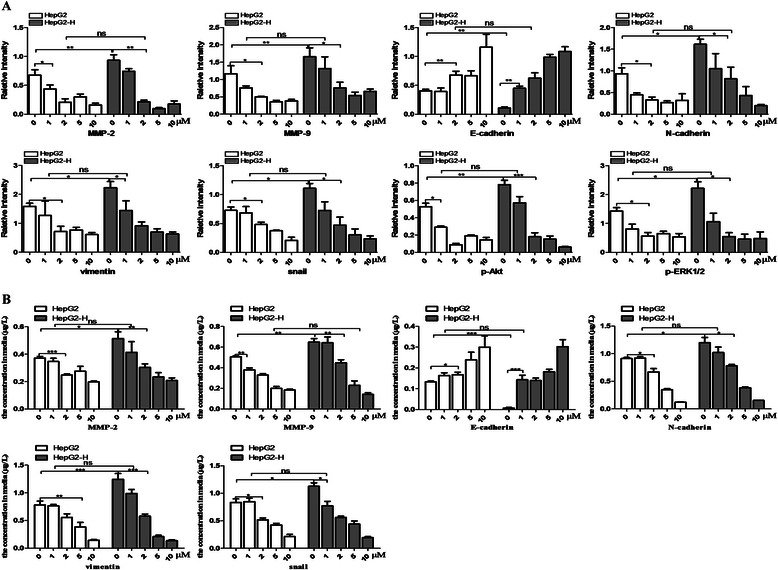
Fig. 4.

Sorafenib suppressed the EMT of HCC cells after insufficient RFA. Gray analysis of all bands was used to quantify expression levels of MMP-2, MMP-9, E-cadherin, N-cadherin, vimentin, snail, p-Akt, Akt, p-ERK1/2 and ERK1/2 in HepG2 and HepG2-H cells (a) The concentration of cytokines secreted into the conditioned medium of HepG2 and HepG2-H cells was detected by ELISA analysis (b). Error bars represent the SEM of data obtained in three independent experiments. P value <0.05 was considered statistically significant; **p < 0.01, ***p < 0.001
