
Fig. 5.
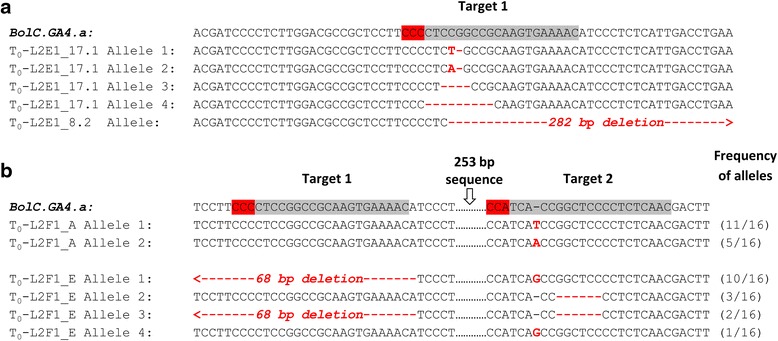
Mutant alleles detected in T0 B. oleracea. Alignment of wild-type and mutant sequences surrounding the target sequences (grey highlight) and PAM (red highlight) in mutants identified by restriction digest/PCR screen (a) and by phenotypic screen (b). Insertions and deletions are indicated by red font or red hyphens, respectively. For large deletions, red arrows indicate the direction of the deletions. For each line in panel b (L2F1_A and L2F1_E), 16 clones were examined and the frequencies of each mutant allele (represented as clones with mutant allele/total number of clones examined) are indicated at the right side of the panel