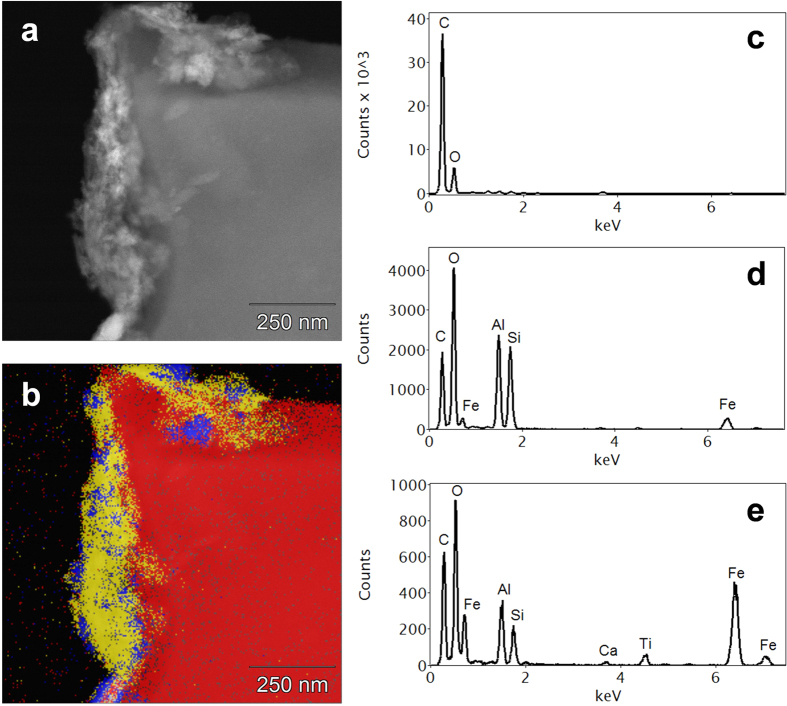
Figure 4.
(a) HAADF image showing an organomineral layer (bright) coating an external surface of a biochar particle; (b) Phase map of (a) derived from x-ray microanalysis spectrum imaging, showing three distinct phases; Average EDS spectra of: (c) red (biochar) phase in (b) containing C and O only; (d) yellow (clay) phase in (b) containing mainly C, O, Al and Si; (e) blue (Fe-rich) phase in (b). Both mineral phases [(c,d)] have a considerable organic content.

