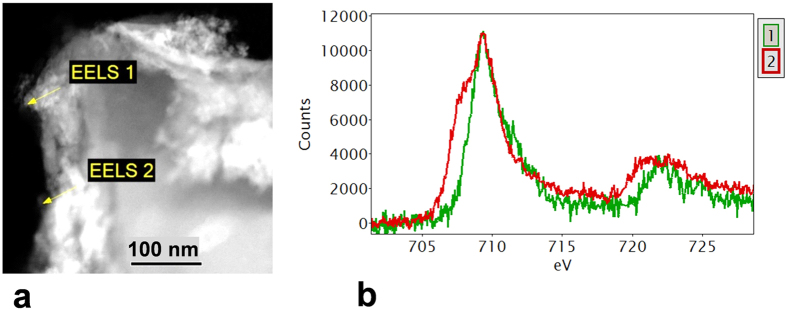
Figure 5.
(a) STEM HAADF image of biochar with organomineral layer; (b) Fe-L2,3 EELS spectra (background stripped) were obtained from the points marked in (a). The EELS 1 spectrum is characteristic of haematite (Fe III). The spectrum from EELS 2 (red line) shows a pronounced low energy shoulder, suggesting a mixed (II–III) valence state. Note: peak maxima aligned at 709 eV for comparison.

