
Figure 1.
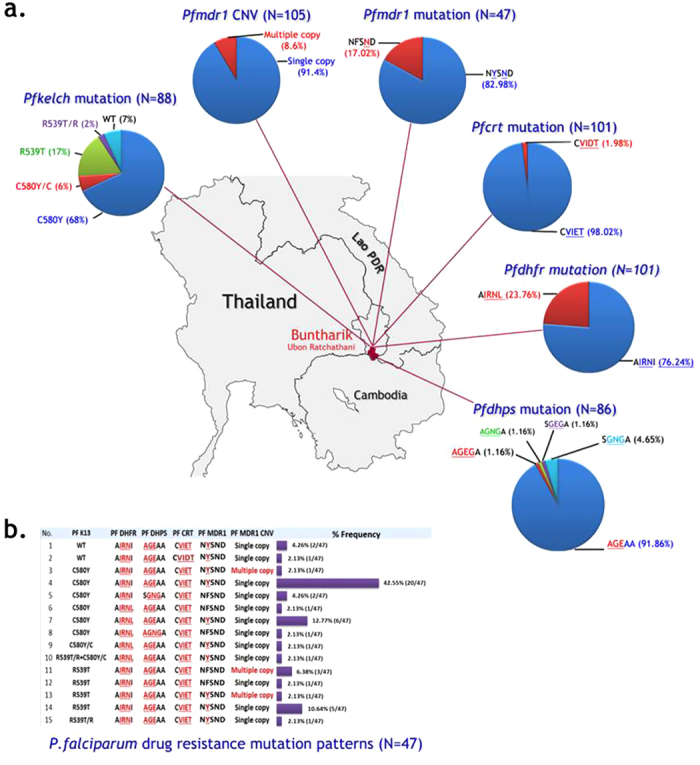
(a) Pie charts representing proportions of mutations or gene-amplification in five resistance genes (Pfkelch, pfcrt, pfdhfr, pfdhps and pfmdr1) observed in P. falciparum isolates from Ubon Ratchathani. A total of 101 samples were genotyped, but full genotyping of all resistance markers was not accomplished in all samples (see denominators shown next to pie charts) The map was created using Adobe® Photoshop® CS6 version 13.1.2 × 64 software (Copyright© 1990–2012 Adobe Systems Incorporated). (b) Bar chart representing the patterns observed in the five antimalarial drug resistance genes assessed in this study.