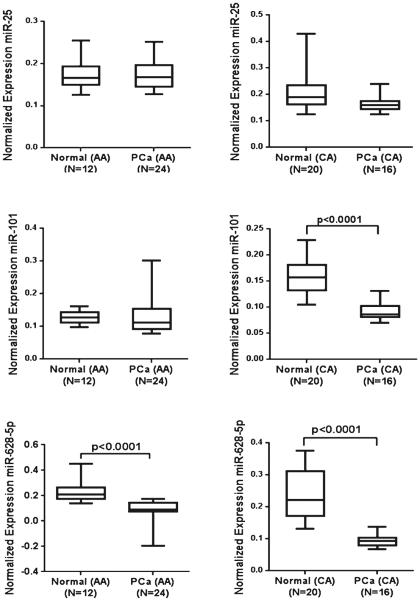
Fig. 2.
Comparison of miRNA expression on the basis of ethnicity. Box plots represent the differences in expression levels of three miRNAs in the serum of PCa patients as compared with their normal adjacent counterpart in African American (AA) and Caucasian American (CA) populations. Expression levels of the miRNAs were normalized to miR-223 as the endogenous control. Statistically significant differences were determined using unpaired Student's t test

