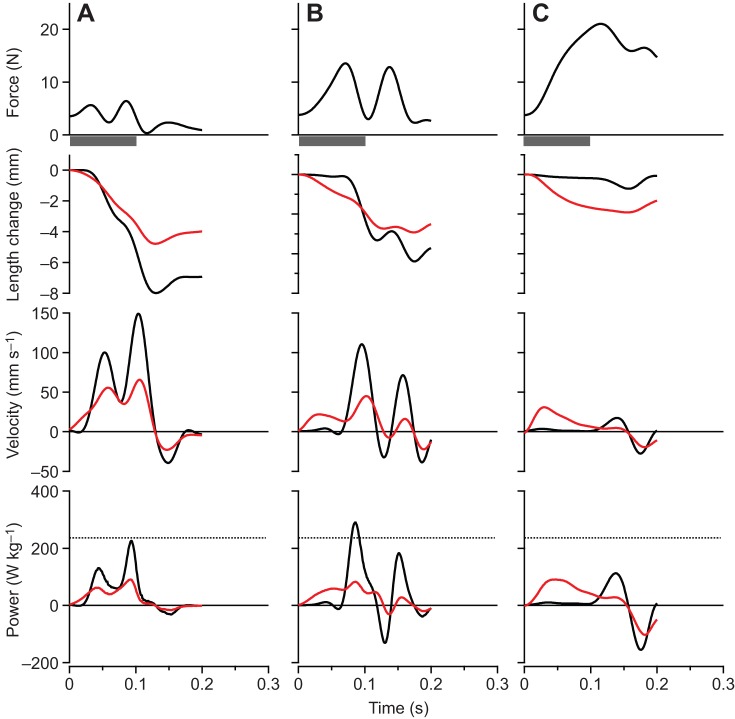
Fig. 3.
Contractions from a single plantaris muscle preparation for a range of simulated loads. (A) A light (Fload/Fo=0.175), (B) an intermediate (Fload/Fo=0.375) and (C) a heavy (Fload/Fo=0.875) simulated load. Black traces are for the whole MTU, while red traces indicate values for fascicles. The highest powers occur at intermediate loads, and peak power output at this load exceeds the muscle's maximum isotonic power (denoted by the dashed line, bottom panel). At low loads velocities are high but forces are low, whereas at high loads forces are high but velocities are too low to achieve significant power. The ‘double-humped’ pattern of force and velocity results from oscillation of the muscle–spring–mass system during acceleration of the virtual load. The time of stimulation was 100 ms for all contractions, as indicated by the gray bar below the top panel.

