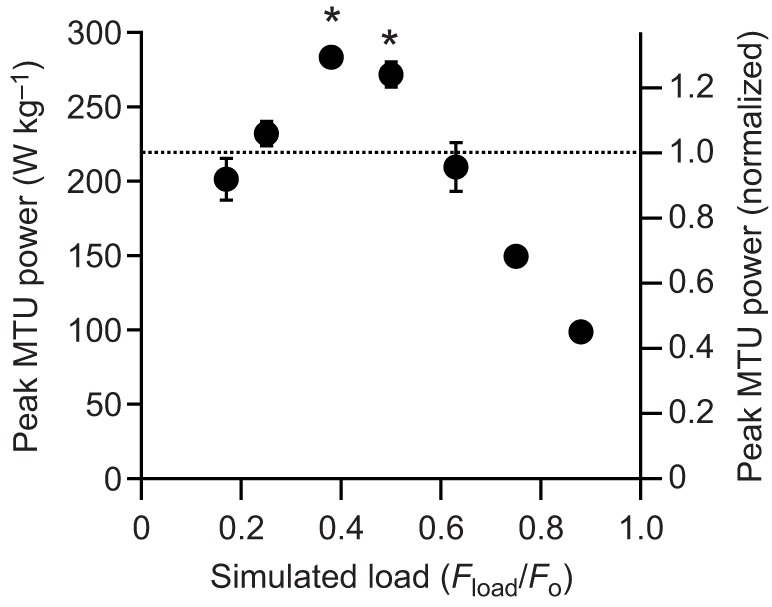
Fig. 4.

Peak power output during muscle contractions against simulated loads. At intermediate loads, peak power output developed by the MTU exceed the peak isotonic power of the muscle contractile apparatus (dotted line). Simulated load (x-axis) is the ratio of the gravitational force on the simulated mass (Fload=m·g), to the muscles’ peak isometric force in a 100 ms contraction, Fo. The right-hand y-axis is the peak power expressed as a proportion of the peak isotonic power output of the muscle. Values are means±s.e.m., N=6. Asterisks indicate significant difference (post hoc pairedt-test; P<0.05) with respect to the peak isotonic power of the muscle contractile apparatus (dotted line).
