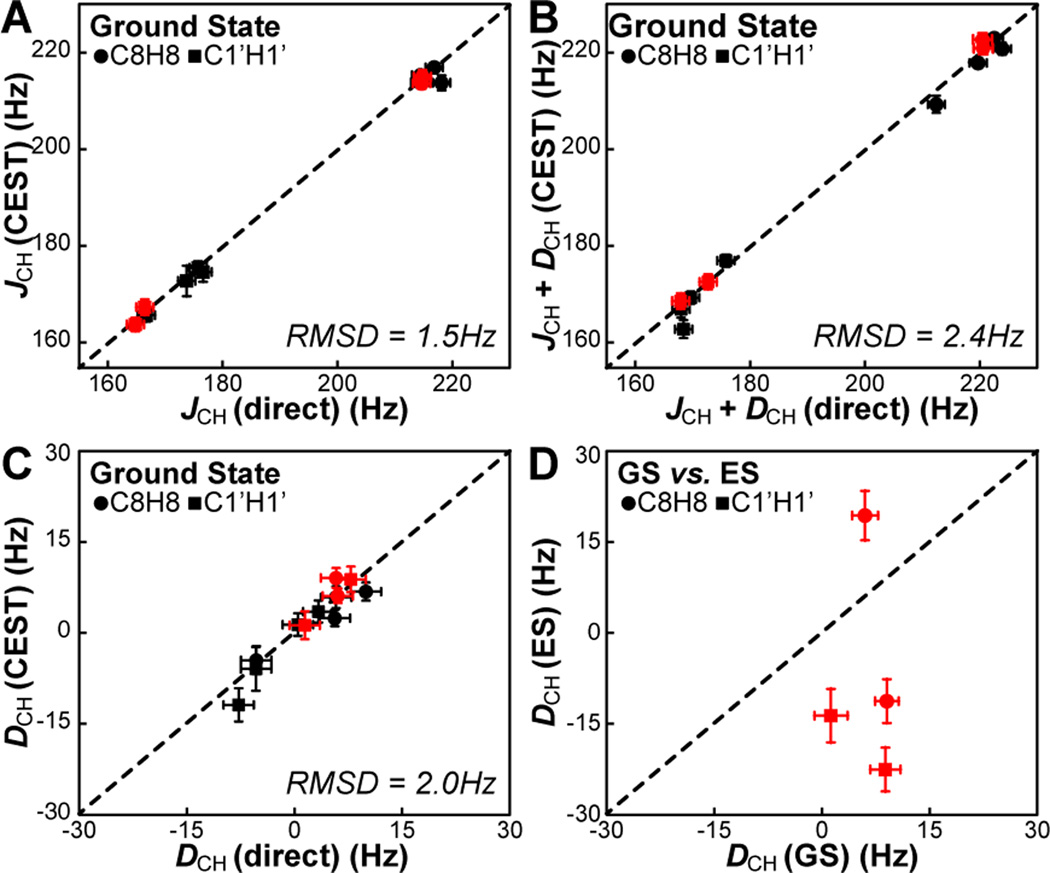
Figure 2.
Measurement of 13C-1H RDCs by 13C HSQC CEST. (A,B) Comparison of ground state (GS) 13C-1H splittings determined from CEST and direct measurements in the absence (A) and presence (B) of 9.7 mg/mL Pf1 phage. (C) GS 13C-1H RDCs (1DCH) determined from CEST approach agree well with values measured directly. G8 and G10 are shown in red. (D) Comparison of base and sugar 1DCH values of ground and excited states (ES) of G8 and G10.

