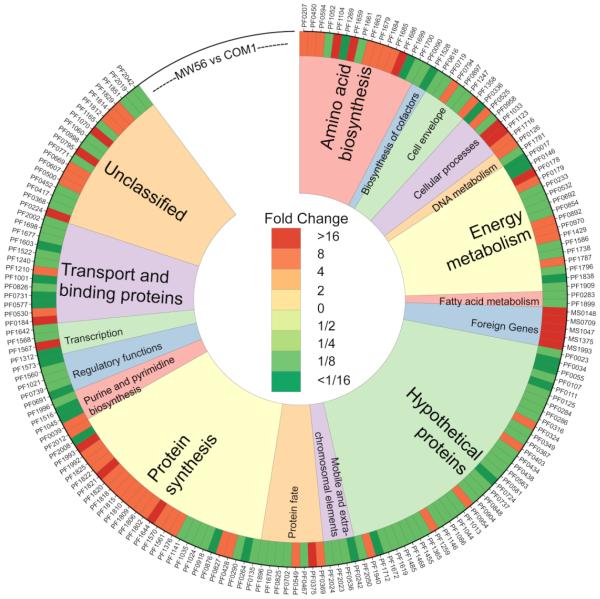
Figure 3. Heatmap showing Differential Transcription between P. furiosus COM1 and P. furiosus MW56 strains.
Select genes with log2-fold changes of ≥ ±2.1, sorted by TIGR functional categories. P. furiosus ORF numbers are listed on outer edge. Red indicates higher transcriptional levels for a given gene in MW56 compared to COM1, while green indicates lower transcription levels. See Figure 2 for microarray experimental loop summary.

