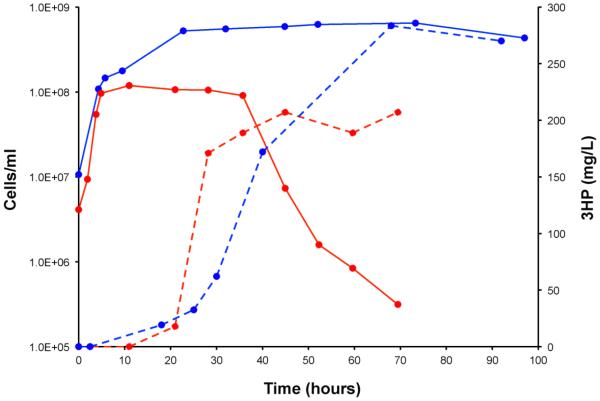
Figure 5. Cell Density and 3HP production levels for selected bioreactor runs.
Solid lines show cell densities (left axis) and dashed lines show 3HP production levels (right axis); MW76-400 is shown in blue and MW76-1000 in red. Note the rapid decrease in cell viability for MW76-1000 (red) compared to MW76-400 (blue), corresponding to higher 3HP production rates.

