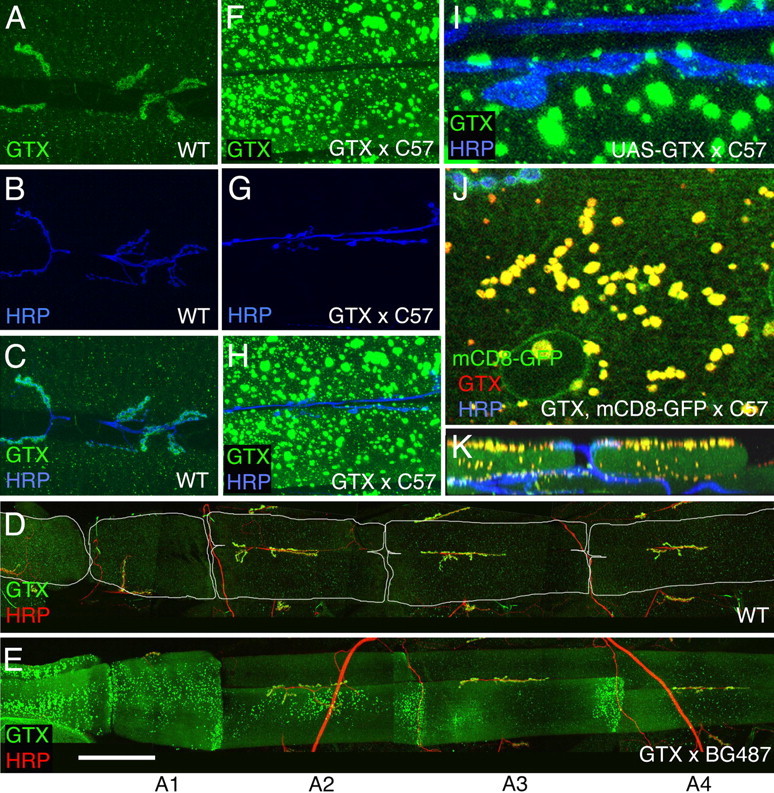
Figure 7.

Effects of overexpressing GTX in larval muscles. A–K, Confocal images of larval NMJs in wild type (A–D) and larvae overexpressing transgenic GTX (E–K) in muscles using the Gal4 driver BG487 (D, E) (weak muscle expression in A3) and C57 (F–K) (strong pan-muscle expression), stained with antibodies to HRP (blue) and GTX (green) (A–C, F–I), GTX (green) and HRP (red) (D, E), and GTX (red), HRP (blue), and mCD8-GFP (green) (J, K). A–C and F–K are images from muscles 6 and 7 in A3, whereas D and E show abdominal segments A1–A4. K is a transversal section through a confocal stack showing the localization of GTX-containing large vesicles at the muscle apical region. Scale bar: A–C, F–H, 50 μm; D, E, 185 μm; I, 8 μm; J, 12 μm; K, 30 μm.
