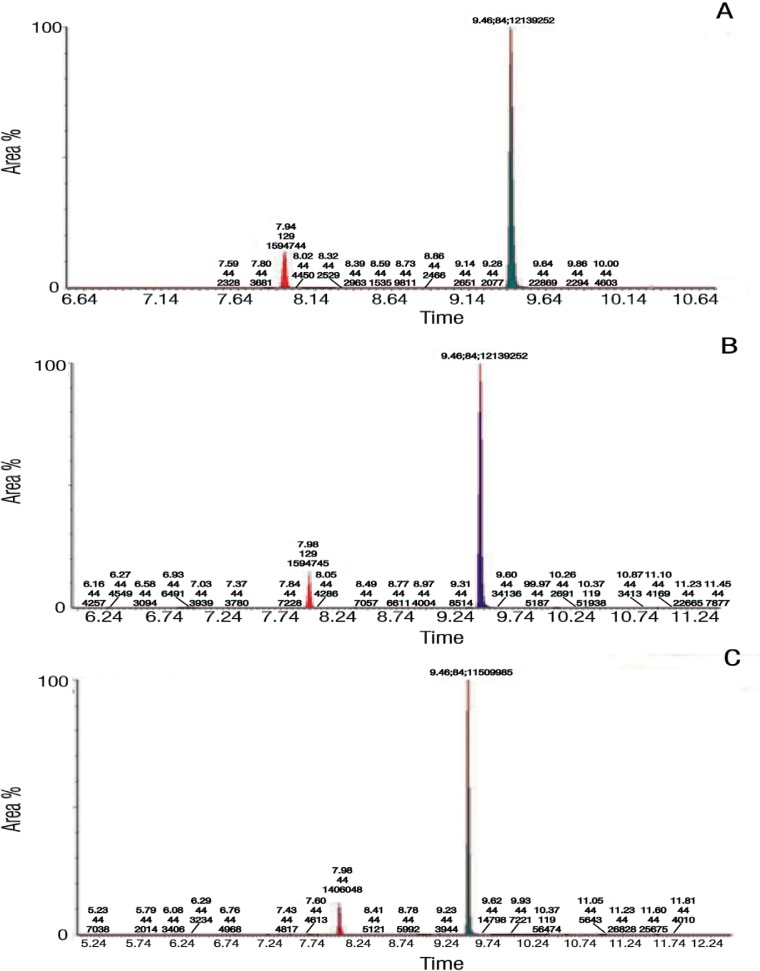
Figure 1A–C:
Gas chromatography-mass spectrometry graphs of the nicotine in the (A) first, (B) second and (C) third Afzal samples. The long peak represents nicotine while the short one represents quinoline (the internal standard). The numbers on the peaks represent the retention time. The spectra mass value is represented in the area under the peak.

