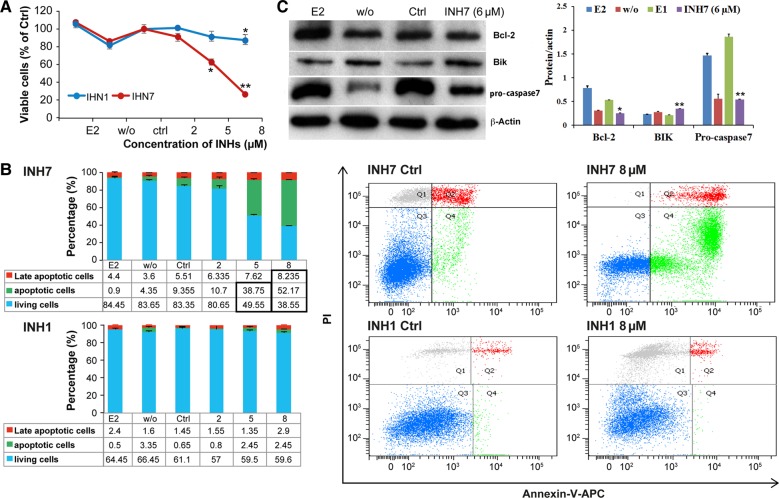
Figure 2.
Apoptotic effect of INH7/INH1 in MCF-7 cells. (A) Cell viability of MCF-7 treated with INH7 or INH1 by MTT assay. Each point represents the mean of experiments carried out in quadruplicate (mean ± SD). Statistical significance by Student's t-test: *P < 0.05 vs. Ctrl. **P < 0.001 vs. Ctrl. (B) Cell apoptosis of MCF-7 treated with INH7 or INH1. Each number represents the mean of experiments carried out in triplicate (mean ± SD). Statistical significance (P < 0.05) by Student's t-test is highlighted in bold box in table. Flow cytometry panels represent the distribution of each cell type after treatment. (C) Expression of Bcl-2, Bik, and pro-caspase 7 in INH7-treated MCF-7 cells. Data are reported as mean ± SD (n = 3) of the individual experiments. Statistical significance by Student's t-test: *P < 0.05 vs. Ctrl; **P < 0.001 vs. Ctrl.

