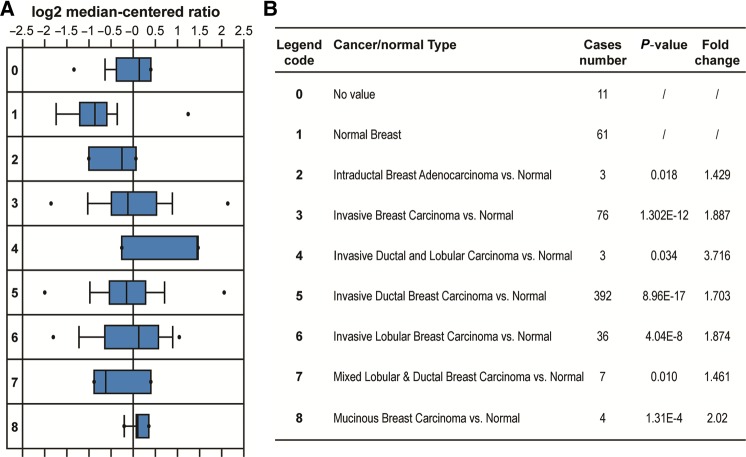
Figure 4.
Integrative analysis of 17β-HSD7 overexpression in neoplastic breast vs. normal breast type. (A) A box plot shows relative 17β-HSD7 expression in TCGA breast datasets grouped by cancer and normal tissue. The box reflects the interquartile range, the whiskers reflect the 10%–90% range, and the dots reflect the minimum and maximum values. Legend code indicates different cancer/normal type described in B. Horizontal axis units are normalized expression values (standard deviation above or below the medium per array). Data are normalized to facilitate inter-study comparison. The box plot was downloaded from ONCOMINE (Rhodes et al., 2004). (B) Comparison of 17β-HSD7 overexpression in different cancer types vs. normal breast tissue. P-value indicates the difference between two group comparisons. Fold change indicates the fold difference in 17β-HSD7 overexpression in cancer type vs. normal breast tissue.

