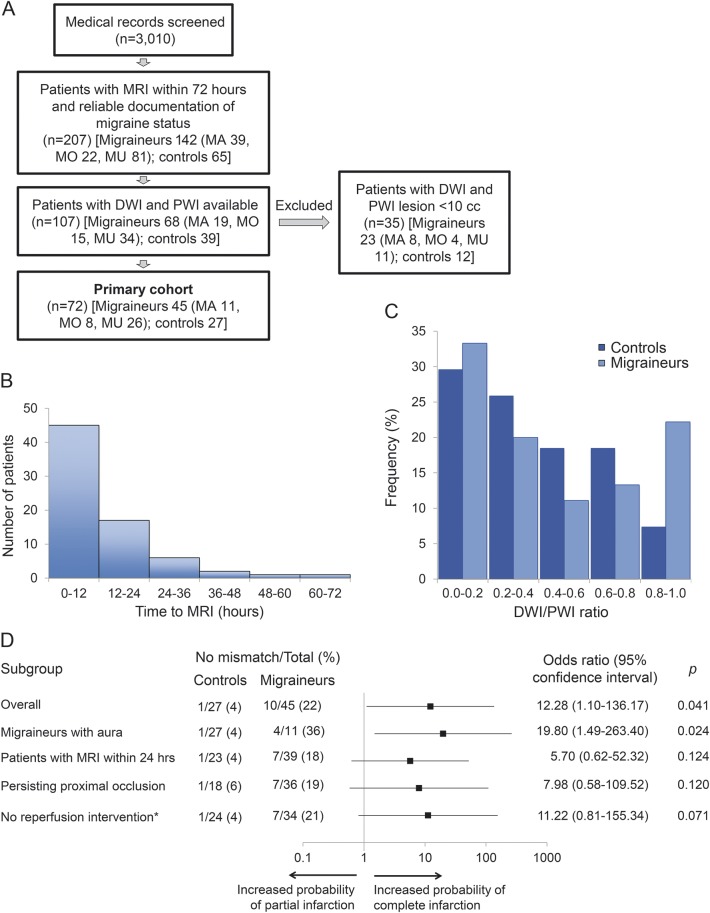
Figure. Study flowchart, time to MRI, and DWI/PWI distribution for the analysis of no-mismatch pattern.
(A) Study flowchart. MA = migraine with aura; MO = migraine without aura; MU = migraine of unknown type. (B) Histogram of time from symptom onset to MRI. (C) Frequency histogram for diffusion-weighted imaging (DWI)/perfusion-weighted imaging (PWI) ratio in controls and migraineurs showed a bimodal distribution in migraineurs. (D) Subgroup analyses for no-mismatch pattern adjusted for time to MRI. Horizontal bars represent odds ratio and 95% confidence interval. *Includes IV thrombolysis and endovascular treatments.

