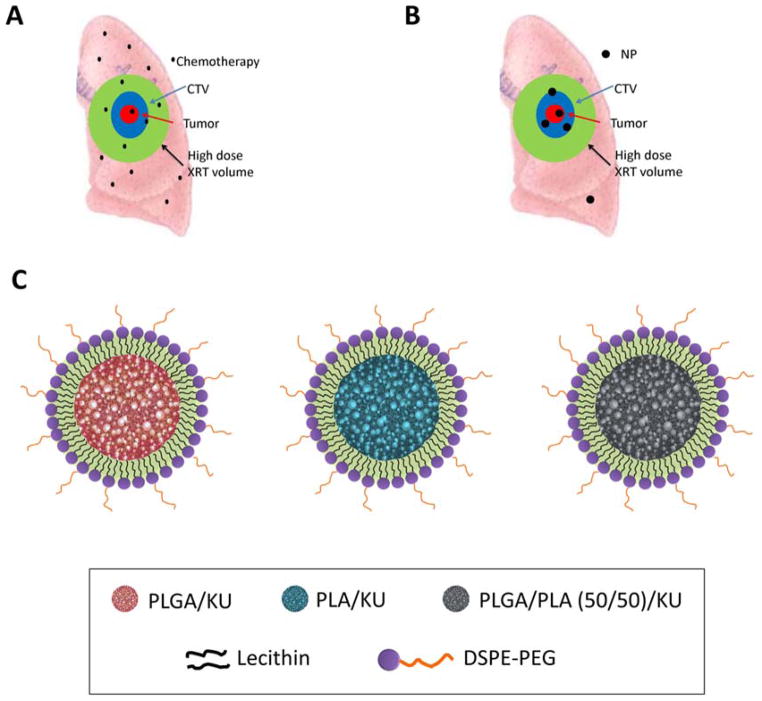
Figure 1.
Diagram of chemoradiotherapy for lung cancer. The red area is the gross tumor. Blue area is CTV (clinical target volume), which is the area of lung that should receive high dose radiotherapy and radiosensitizer. Green area indicates the area of lung tissue that receives high dose radiotherapy (XRT) because of motion, entrance and exit radiotherapy dose. In conventional treatment (A) with small molecule chemotherapeutics such as KU55933, the green area receives both high dose radiotherapy and radiosensitizers. In contrast, NP therapeutics (B) concentrate in tumors and minimize the area of normal lung that receives both radiotherapy and radiosensitizer/chemotherapy. (C) Cartoon of NP KU55933 with different lipid polymers.

