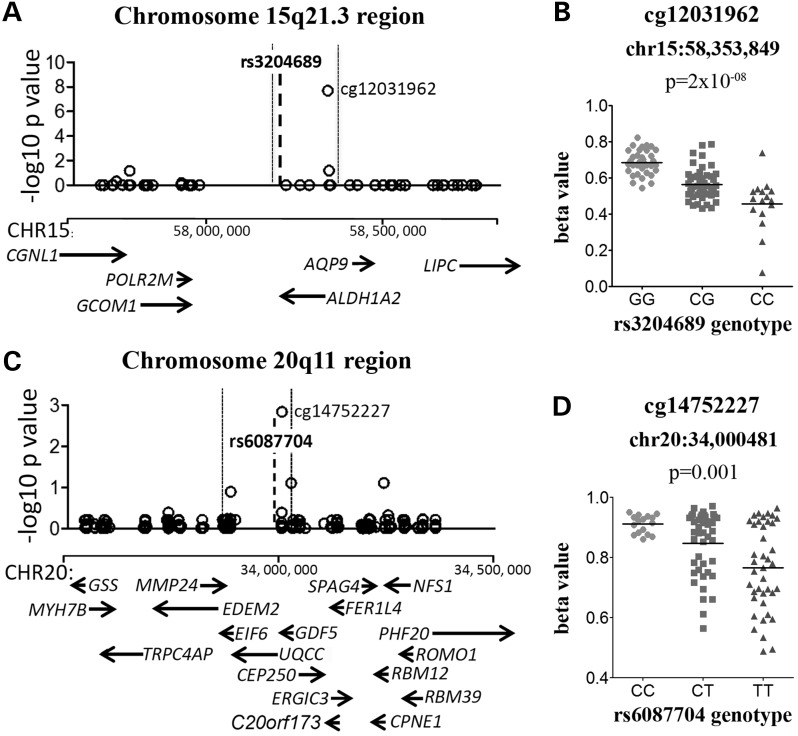
Figure 3.
Genotypes at rs3204689 and rs143383 (rs6087704*) correlate with the methylation levels of the cg12031962 and cg14752227 CpG sites, respectively. (A). (C) Plots show the association between the OA-associated SNP and the methylation levels of CpG probes that are present within each LD block for that SNP. The genomic position of the CpG probes analysed is plotted on the x-axis, and the Benjamini–Hochberg corrected –log10 P-value of the correlation between the genotype and the CpG probe β-value plotted on the y-axis. Each open circle represents a single CpG probe, and the significant associations are indicated. The genomic location of the OA-associated SNP is indicated by the bold dashed line, and the LD block is indicated by the vertical dotted lines. The genes within the region analysed are indicated below the association plot by arrows. (B), (D) Graphs of the association between genotype and methylation β-values for (B) rs3204689-cg12031962 and (D) rs143383-cg14752227. For rs3204689 and rs143383, data are shown for all 99 samples. Horizontal line represents the mean. *rs143383 is not present on the HumanOmniExpress genotyping array and rs6087704, an array SNP that has the highest LD with rs143383 (r2 = 0.93), was therefore used to infer rs143383 genotypes.

