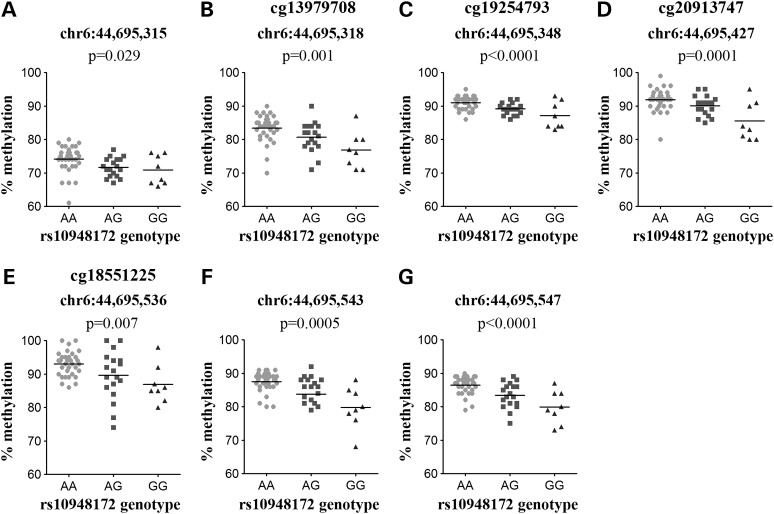
Figure 5.
Replication of the association between rs10948172 and DNA methylation. (A–G) Graphs show the association between genotype at rs10948172 and the methylation levels at seven CpGs measured by pyrosequencing; the four discovery CpGs (B, cg13979708; C, cg19254793; D, cg20913747 and E, cg18551225) and the three additional CpG sites captured by the assays located (A) 3 bp upstream of cg13979708, (F) 7 bp downstream of cg18551225 and (G) 11 bp downstream of cg18551225. Data are shown for the 57 OA samples studied. P-value was calculated using a Kruskal–Wallis test and was Bonferroni-corrected for multiple testing. Horizontal line represents the mean.

