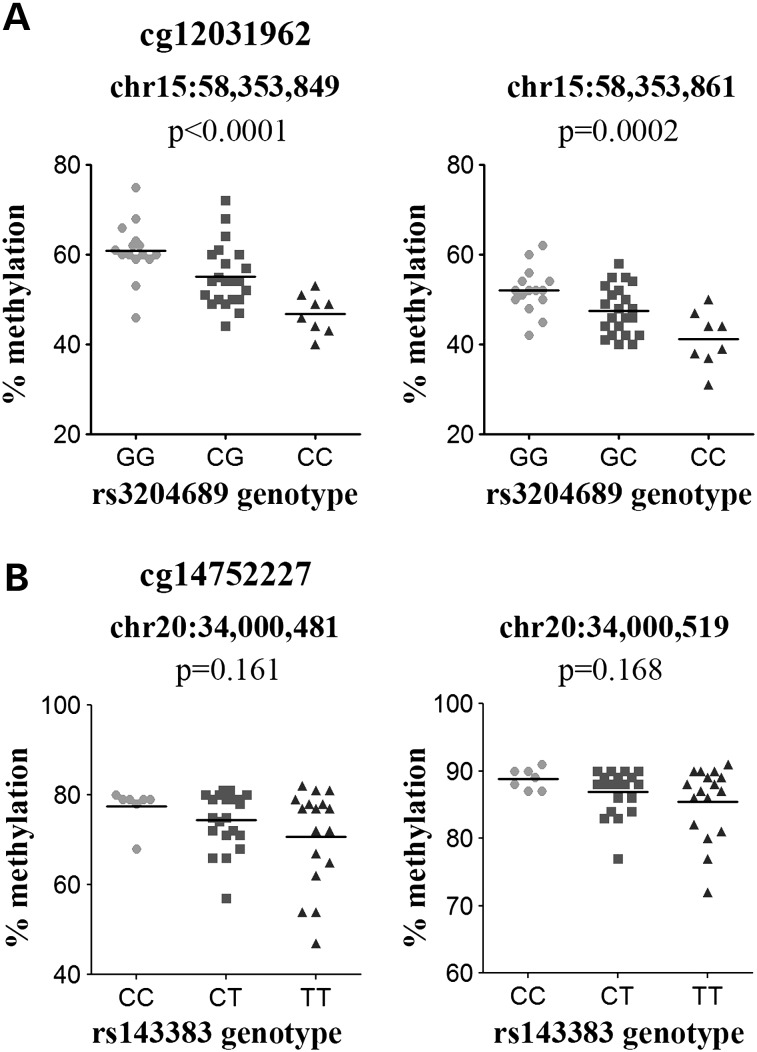
Figure 6.
Replication of the (A) ALDH1A2 rs3204689-cg12031962 and (B) UQCC/GDF5 rs143383-cg14752227 meQTLs. For rs3204689, data are shown for the discovery CpG, cg12031962 (left) and an additional CpG located 12 bp downstream (right). For rs143383, data are shown for the discovery CpG, cg14752227 (left) and an additional CpG captured by the assay located 38 bp downstream of cg14752227 (right). For both SNPs, data are shown for the 45 samples studied; 40 OA and 5 NOF. P-value was calculated using a Kruskal–Wallis test and was Bonferroni-corrected for multiple testing. Horizontal line represents the mean.

