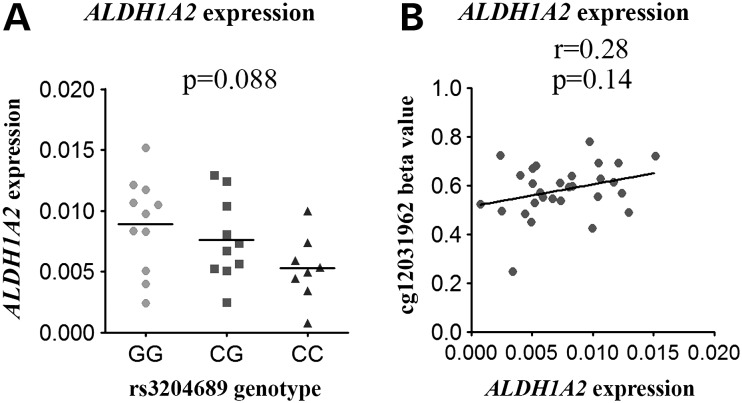
Figure 7.
eQTL and methylation–expression correlations for ALDH1A2. (A) ALDH1A2 expression in cartilage from 29 OA knee patients stratified by genotype at rs3204689. Horizontal line represents the mean. (B) ALDH1A2 expression plotted against methylation at cg12031962. r represents the Spearman rank coefficient and the P-value was calculated using a Kruskal–Wallis test and was Bonferroni-corrected for multiple testing.

