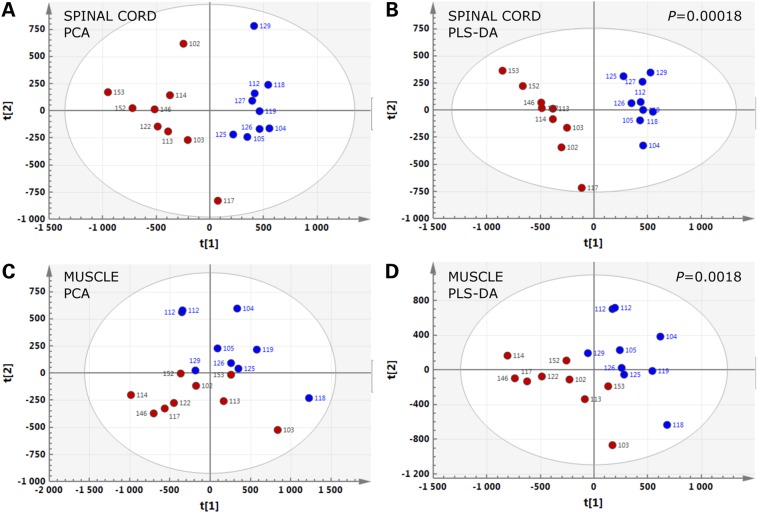
Figure 1.
Lipidomic signatures in spinal cord and muscle of SOD1(G86R) mice. PCA (A and C) and PLS-DA (B and D) score plots showing the spatial distribution of SOD1(G86R) mice at the pre-symptomatic stage (blue circles, n = 9) and WT littermates (red circles, n = 9), according to the lipidomic profiles of spinal cord (A and B) and muscle (C and D).

