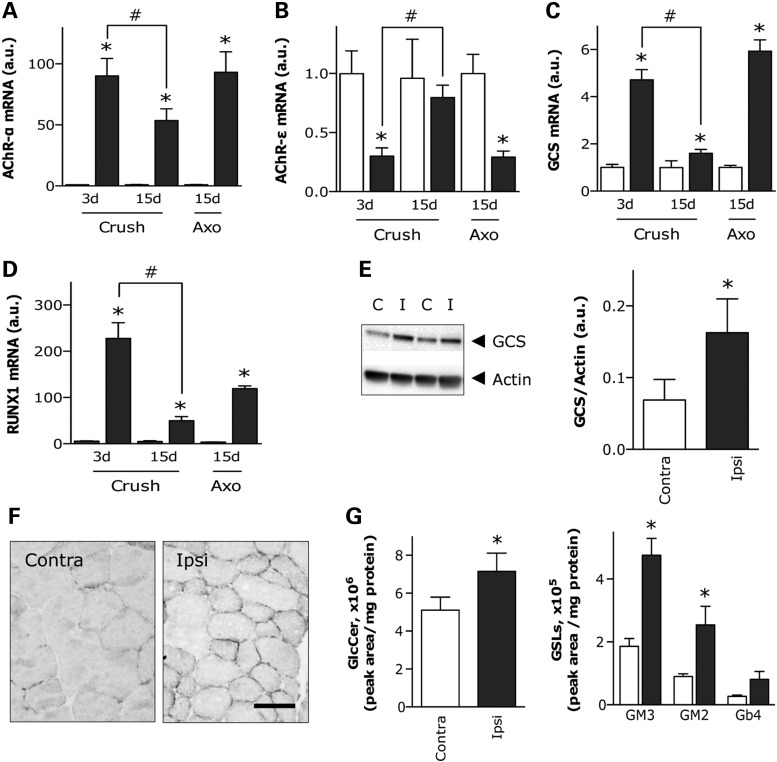
Figure 5.
GCS expression in denervated muscle of WT mice. Relative mRNA levels of AChR-α (A), AChR-ε (B), GCS (C) and RUNX1 (D) in muscle of WT mice submitted to sciatic nerve crush or axotomy (Axo). Muscles were processed at the indicated days post-lesion. Ipsilateral muscles (red bars) were compared with contralateral muscles (white bars) in the same animal. *P < 0.05 versus corresponding contralateral muscle, #P < 0.05 versus preceding time point following nerve crush, n = 5–7. (E) GCS protein levels, as determined by western blot (a representative blot is shown in the left panel), in muscle of WT mice submitted to nerve crush as in A. Right panel shows quantification of immunoblots using actin protein levels as internal reference. *P < 0.05, n = 8. (F) Representative photomicrographs showing GCS immunostaining on cross-sections of contralateral and ipsilateral muscle as in A. Scale bar, 50 µm. (G) HPLC quantification of GlcCer (left panel) and several GSLs (right panel) in muscle of WT mice submitted to sciatic nerve crush as in A. Only detected main peaks of gangliosides are shown. *P < 0.05 versus corresponding contralateral muscle, n = 7–8.

