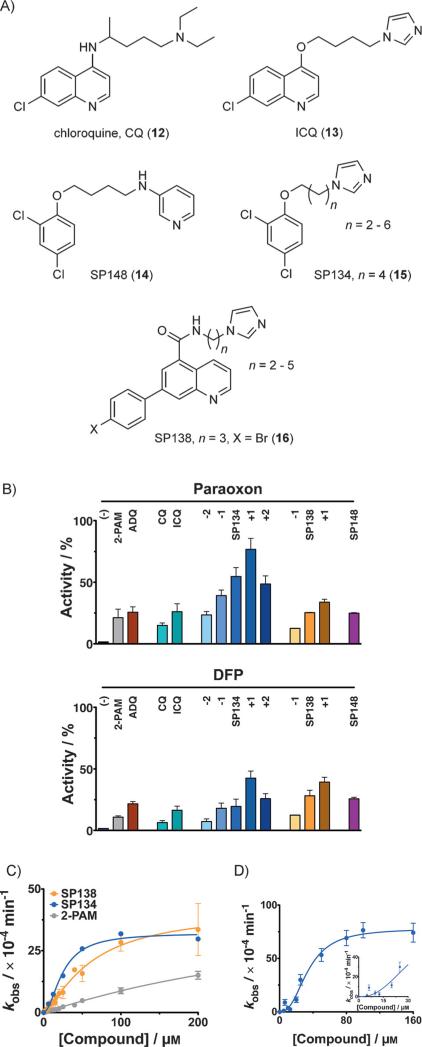
Figure 3.
Reactivation of AChE with analogues of 6. A) ADQ (6) was the starting point for optimization, leading to chloroquine (CQ, 12) and ICQ (13), and then the SP series [e.g., SP148 (14), SP134 (15), and SP138 (16)]. B) Reactivation by different analogues of 6 (12.5 μm each) of 1-inhibited (left) and 2-inhibited (right) human AChE. Analogues of 15 and 16 with different linker lengths were synthesized; the difference in the number of carbon atoms (n) in the linker is indicated as +1, +2, etc. Activity is expressed relative to uninhibited enzyme. C) Concentration dependence curve for the reactivation of human AChE inhibited by 2—variously with 15 (blue), 16 (orange), or pralidoxime (5, 2-PAM, gray), with 15 and 16 being more efficient. D) Kinetics of reactivation by 15 of 2-inhibited mouse AChE were best fit to a sigmoidal curve with a Hill coefficient of ≈(2.5±0.31), agreeing with the crystal structure in Figure 4. Inset shows narrow range of the titration curve. All reactivation reactions were done in triplicate or in duplicate on multiple days (minimum of quadruplicate). Error bars show standard deviations. Full kinetic parameters can be found in Table S1.

