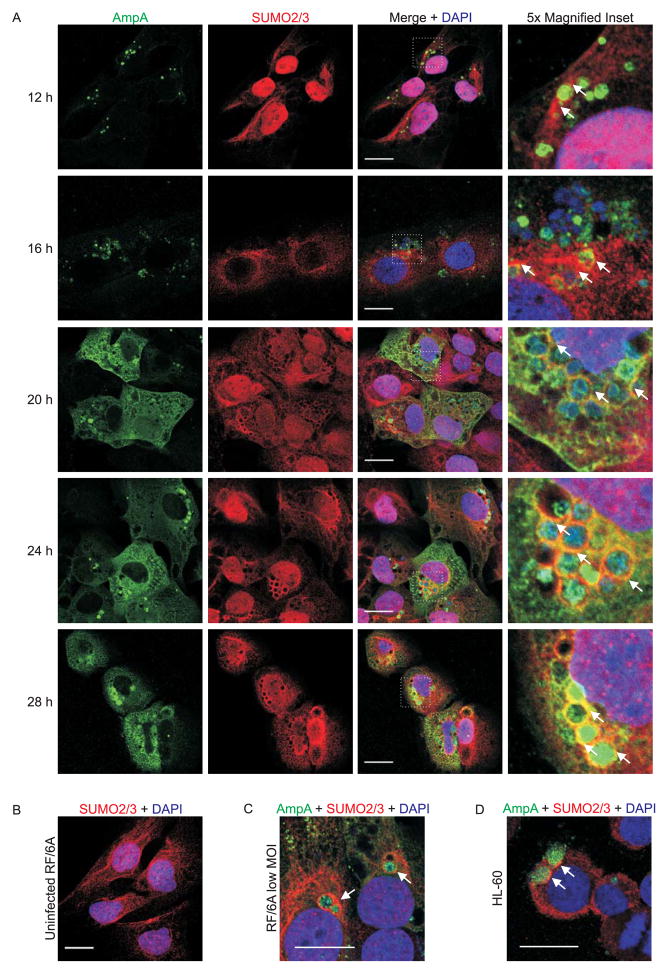
Fig. 6.
Localization of SUMO2/3 and AmpA in A. phagocytophilum infected mammalian host cells. A. Representative images of infected RF/6A cells at 12, 16, 20, 24, and 28 h post infection. Time points are marked at the left of each row. Cells were immunofluorescently stained to detect AmpA (green), SUMO2/3 (red), and DNA (DAPI, blue). Merged images are shown in the third column. Areas demarcated by white hatched boxes in the merged column are magnified five-fold in the fourth column. B. SUMO2/3 (red) and DNA (DAPI, blue) staining in an uninfected RF/6A cell. C and D. Merged confocal images of RF/6A cells infected with a low MOI of A. phagocytophilum (C) and A. phagocytophilum infected HL-60 cells (D) stained for AmpA (green), SUMO2/3 (red), and DNA (DAPI, blue) at 24 h post infection. White arrows indicate representative areas where AmpA and SUMO2/3 signals colocalize and/or SUMO2/3 accumulates on the AVM. Scale bars, 20 μm.

