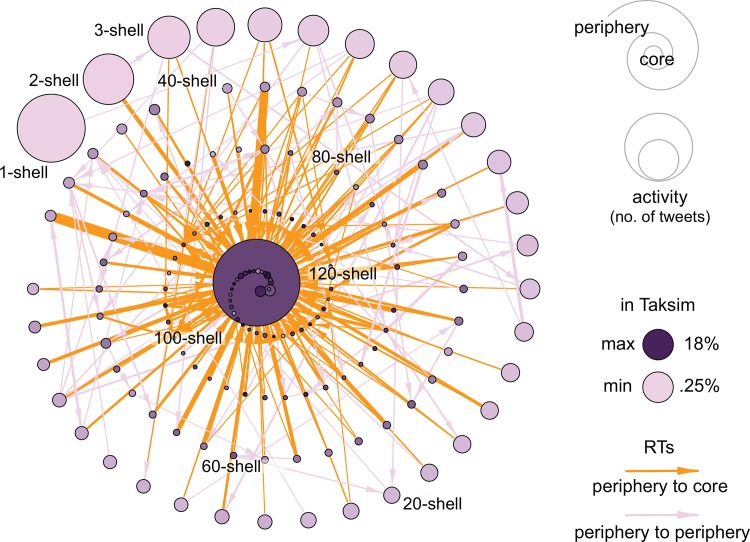
Fig 3. K-core decomposition of the network of retweets that emerged during the 2013 Taksim Gezi Park protests in Turkey (see S1 Text).
Participants have been grouped in their corresponding k-shells, here represented by nodes. Lower k-shells contain participants at the periphery of the network; higher k-shells contain core participants. Node size is proportional to aggregated activity, measured as total number of protest messages (not just retweets). Arcs indicate retweeting activity, and their width is proportional to normalized strength (arcs with lower strength have been filtered to improve the visualization of the network). The darkness of nodes is proportional to the percentage of participants who reported being in the Taksim Gezi Park (the geographical epicenter of the protests), as indicated by the geographic information attached to their tweets. Most of these participants are at the core of the network where most RTs are also sourced from, thus allowing information to flow from the core to the periphery.

