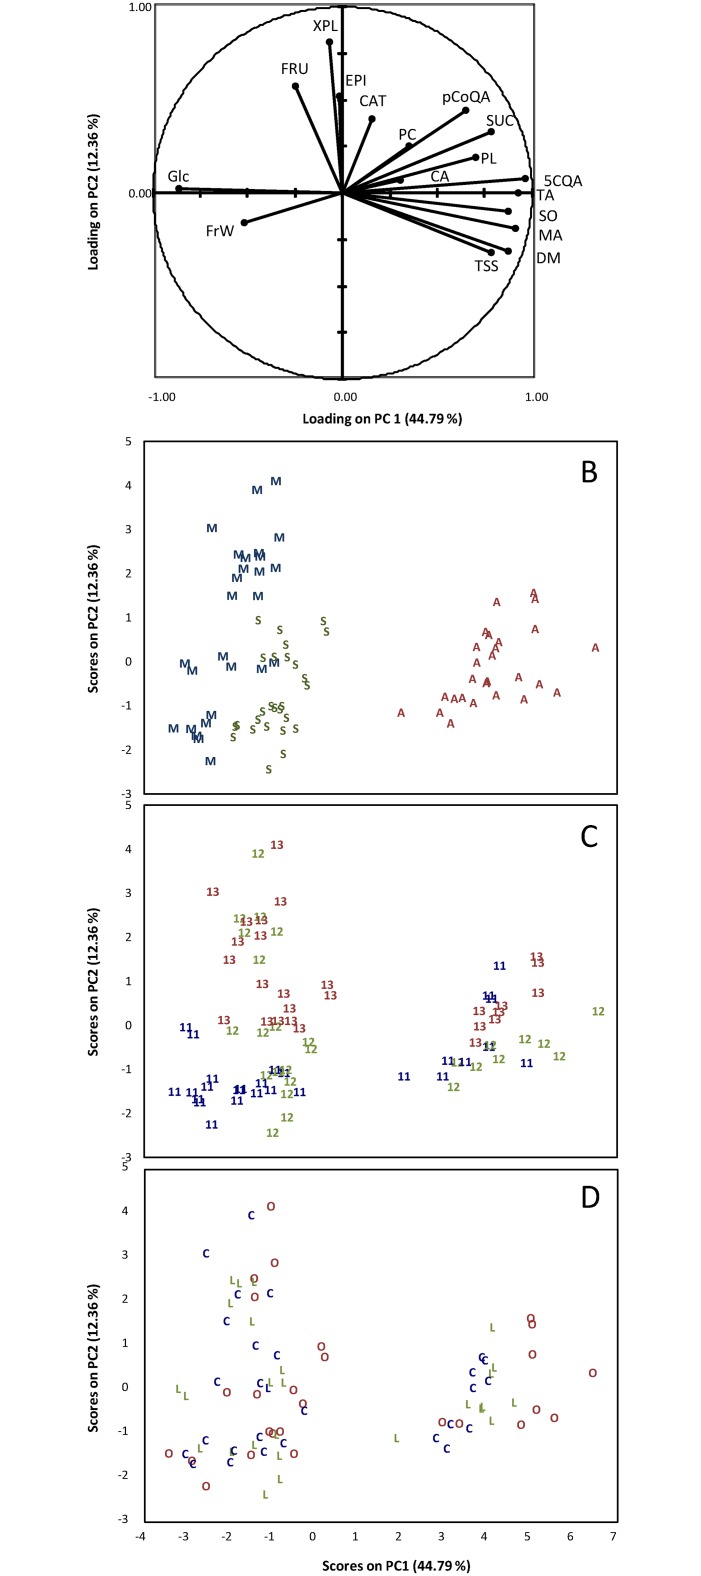
Fig 2. PCA results on individual sugars, organic acids, titratable acidity, dry matter, fruit weight, phenolics and total soluble solids of apple pulp. A: Correlation circle of variables loadings on PC1 and PC2. B: Sample map of scores on PC1 and PC2 as function of the cultivar. C: Sample map of scores on PC1 and PC2 as function of the year. D: Sample map of scores on PC1 and PC2 as function of the management system.
The code corresponds to the cultivar (M: Melrose, S: Smoothee, A: Ariane), to the management system C: conventional, O: organic, L: low-input), and to the year (2011, 2012 and 2013).

