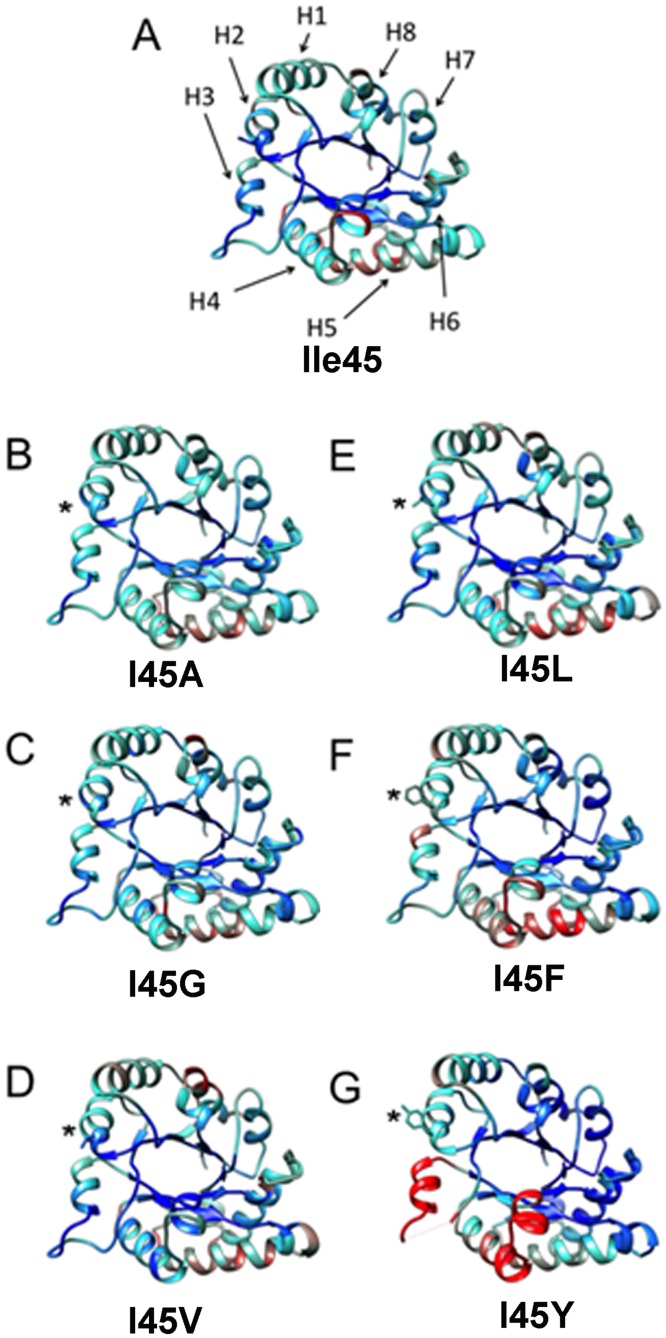
Fig 7. Comparison of the normalized B-factor values of TvTIM1 and mutants at residue 45.
Crystal structure of the wild-type enzyme and the mutants ribbons indicating the variation of the normalized B-factors (A) TvTIM1 structure, the mean value of the normalized B-factor is represented in cyan, the lower value is blue, and the highest B-factor value is red. (B) I45G, (C) I45A, (D) I45V, (E) I45L, (F) I45F and (G) I45Y. The position of the eight α-helices of the (β-α)8 barrel fold is indicated by arrows (H1–H8) on TvTIM1 structure (A).

