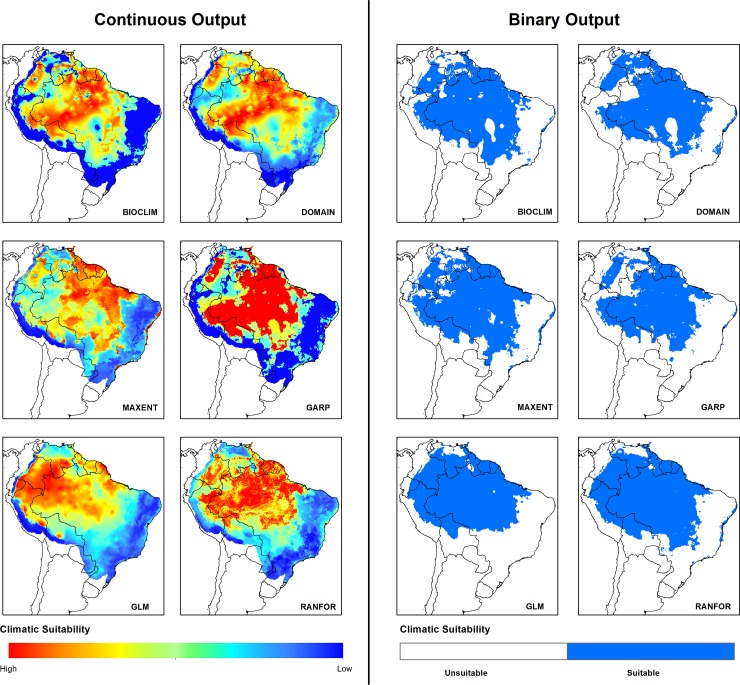
Fig 2. Climate suitability for Lutzomyia flaviscutellata in South America under current conditions from six modelling algorithms.
Continuous output: stretched values of climate suitability. Binary output: suitable areas after the application of the threshold that maximizes model sensitivity and specificity.

