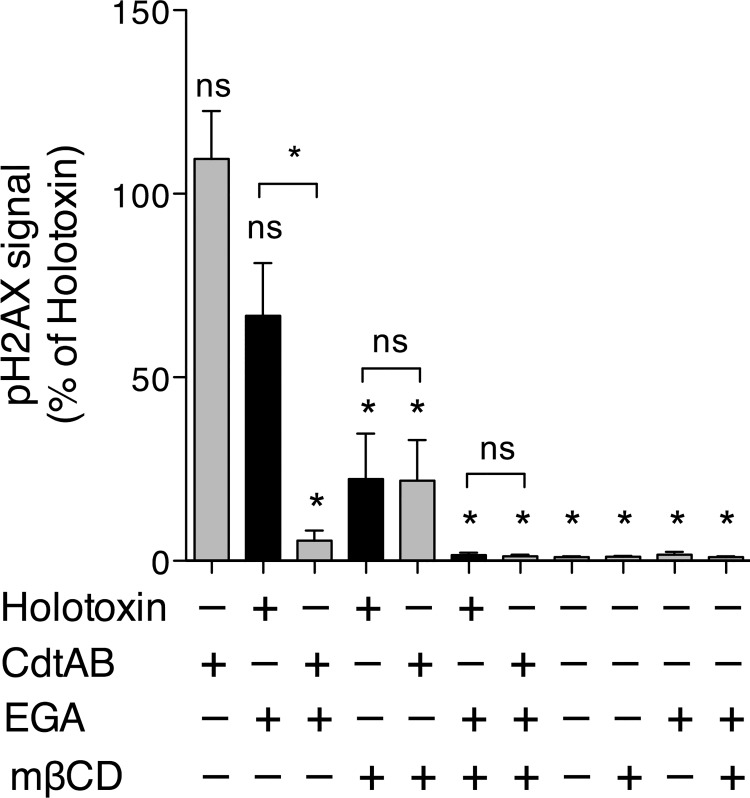
Fig 3. CdtC Mediates Cholesterol Dependency of Ec-CDT.
CHO-A745 cells were seeded at 8 x 10³ cells/well on 96-well plates and allowed to adhere overnight. The next day, cells were incubated with or without 5 mM MβCD and/or 12.5 μM EGA for 1 h then challenged with 1 μM Ec-CDT or Ec-CdtAB for 16 h. Intoxication was assessed by measuring pH2AX by laser scanning cytometry as in Fig 2B. Data were normalized against pH2AX signal induced by Ec-CDT holotoxin (maximum signal) in each experiment. Graphs represent average values and SEM from three independent experiments, each performed in triplicate. All statistical analyses are from the pairwise post-test (Tukey’s) derived from one-way ANOVA. (Prism 5, GraphPad). Symbols above each column reflect comparison to Ec-CDT holotoxin (ns = not significant; * p < 0.001). Additional pairwise comparisons are indicated by brackets.

