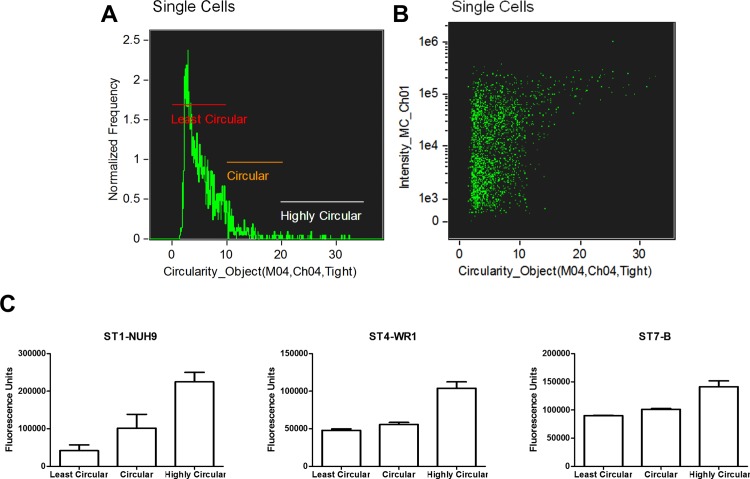
Fig 4. Round Blastocystis have higher DNA content.
Blastocystis cells were plotted according to circularity using the software’s shape wizard. The population of cells was then divided into three groups: low, mid and high circularity (A). A dot-plot was generated to analyze the relationship between circularity and DNA content indicated by Hoechst staining of Blastocystis cells (B). The dot-plot shows that some highly circular cells have the highest DNA content while the least circular cells have the lowest DNA content. Bar graphs show the average Hoechst-staining of the three groups of Blastocystis cells based on circularity (C). Differences between groups based on circularity in each ST were found to be significant (p < 0.05) using ANOVA.

