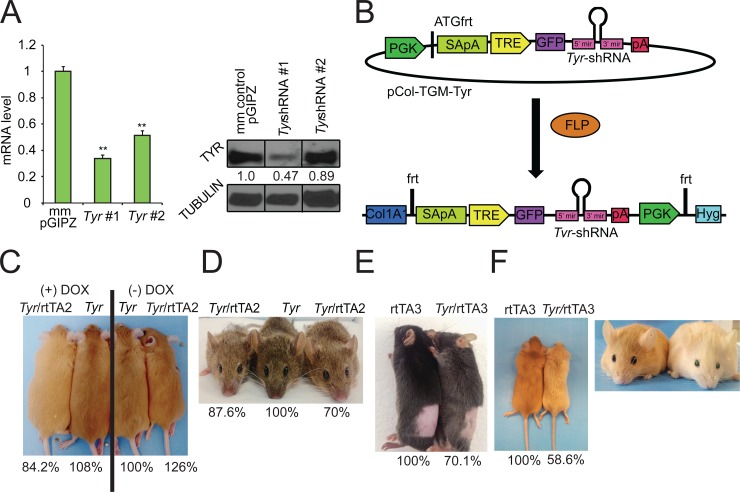
Fig 1. Tyr depletion leads to coat color changes in three unique coat color backgrounds.
(A) B16 mouse melanoma cells infected with the lentiviral constructs containing individual shRNAs were harvested for quantification of Tyr mRNA (left panel) and protein (right panel). The values below the TYR protein bands in the western blot represent the relative intensity of the TYR band normalized to the tubulin band (loading control) for each lane divided by the relative expression of the TYR band in the mismatch-control (mm control) sample. (B) Mouse KH2 ES cells containing a FRT-hygro-pA cassette on chromosome 11 and a reverse tet-transactivator (rtTA) on chromosome 6 were co-electroporated with pCAGGS-FLPe and the targeting vector, pCol-TGM-Tyr. Resulting FLPe-mediated recombination between the FRT site at the Col1a1 locus and the FRT sites present within pCol-TGM-Tyr results in colonies that survive hygromycin selection. (C-F) Effect of Dox-mediated Tyr shRNA on coat color was analyzed in (C,F) yellow agouti, (D) white-bellied agouti, or (E) non-agouti (black) mice by comparison of littermates. The genotype of each mouse is listed above each photo. The percentage value below each mouse corresponds to the absorbance at 492 nm for that particular mouse divided by the absorbance at 492 nm for its control littermate, which is set to 100%. (C) Yellow-agouti littermates with the rtTA2 driver; (D) agouti littermates with the rtTA2 driver; (E) black (non-agouti) littermates with the rtTA3 driver and (F) yellow agouti littermates with the rtTA3 driver were shaved on their dorsal side and then photographed. rtTA3 and Tyr-shRNA/rtTA3 littermates each maintained on a doxycycline diet were photographed in daylight at P100 to demonstrate the presence of GFP in the eye.

