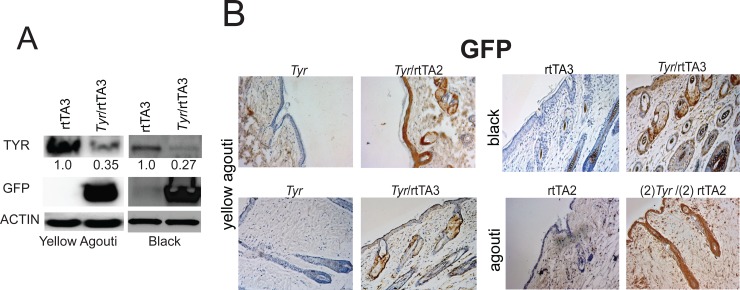
Fig 2. Depletion of TYR protein in skin in Tyr-shRNA; rtTA3 mice.
(A) Four-mm skin punch biopsies were taken at P100 from three different coat color backgrounds. Total protein was extracted and used to immunoblot for TYR and GFP. The numerical values present below the TYR protein bands in the western blot represent the relative intensity of the TYR band normalized to the beta-actin band (loading control) for each lane divided by the relative expression of the TYR band in the rtTA3 control sample. (B) Four-mm skin punch biopsies taken from the indicated mice at P100 were formalin fixed, dehydrated, and paraffin embedded. Next, seven-μm thick sections of the skin were cut and immunostained for GFP.

