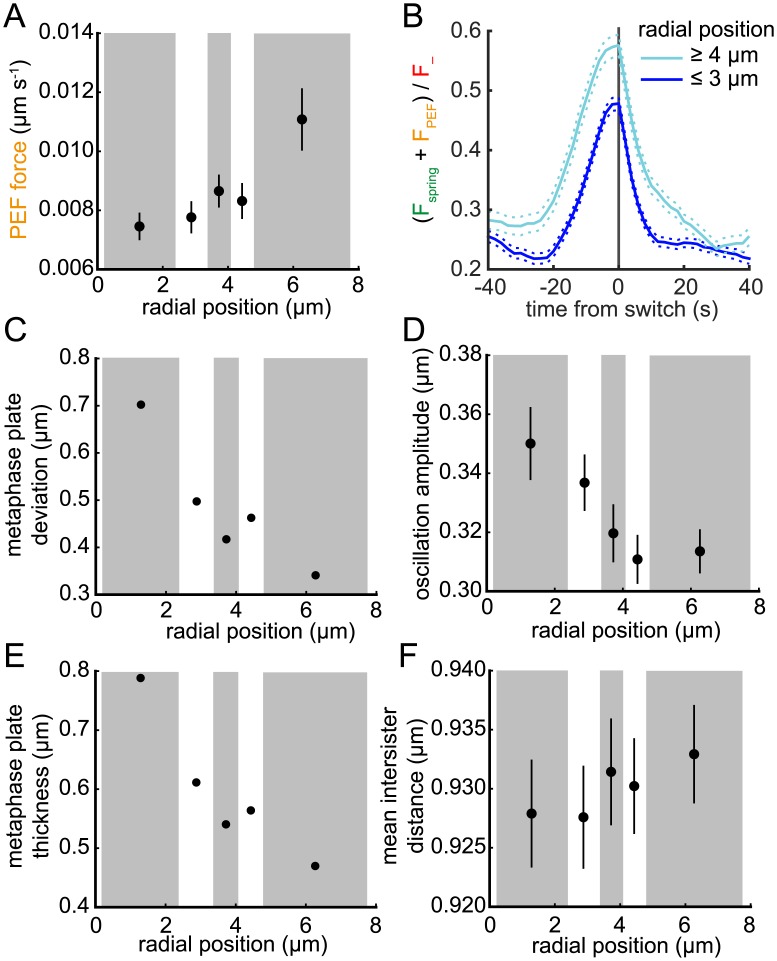
Fig 9. PEF variation over the metaphase plate impacts oscillation amplitude and deviation from alignment.
(A) Average absolute PEF (on sister 1) binned by distance r from the centre of the metaphase plate (bins of approximately equal number; alternating grey and white boxes). (B) Average profile of the proportion of the opposing force (spring + PEF) to F − on lead sister during a LIDS for trajectories with r ≥ 4 μm (cyan) and r ≤ 3 μm (blue). Switch events aligned as described under Fig 8. Solid and dashed lines indicate mean and ±s.e.m., respectively. (C-F) Trajectories binned by distance r as in (A) with bin mean of (C) alignment deviation; (D) oscillation amplitude; (E) metaphase plate thickness; (F) inter-sister distance shown. Lines in (D,F) indicate s.d., n = 843, see text for definitions.

