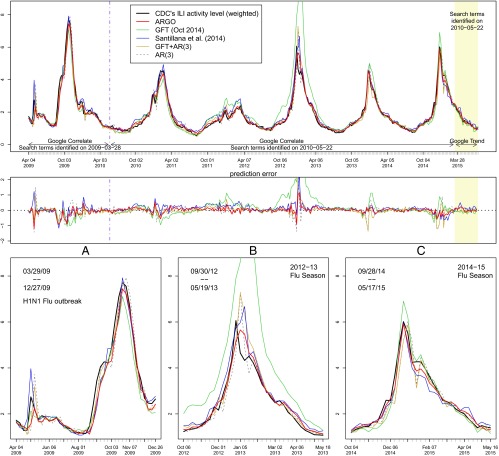
Fig. 1.
Estimation results. (Top) The estimated ILI activity level from ARGO (thick red), contrasting with the true CDC’s ILI activity level (thick black) as well as the estimates from GFT (green), method of ref. 16 (blue), GFT plus AR(3) model (dark yellow), and AR(3) model (dashed gray). The two background shades, white and yellow, reflect two data sources, Google Correlate and Google Trends, respectively. The dash-dotted purple vertical line separates Google Correlate data with search terms identified on March 28, 2009 and May 22,2010. (Middle) The estimation error, defined as estimated value minus the CDC’s ILI activity level. (Bottom) Zoomed-in plots for estimation results in different study periods. (A) The H1N1 flu outbreak period. (B) The 2012–2013 regular flu season. (C) The 2014–2015 regular flu season. A regular flu season is defined as week 40 of one year to week 20 of the following year.

