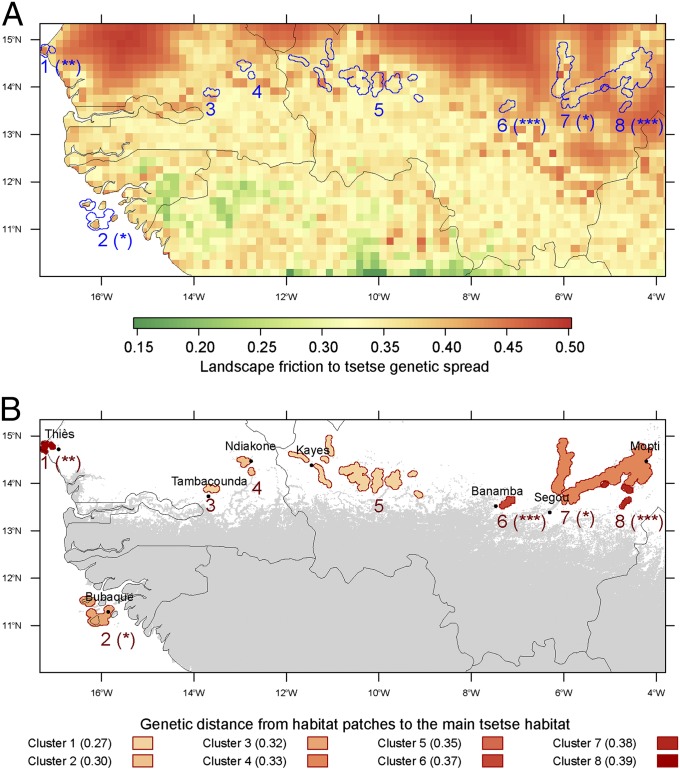
Fig. 5.
Isolated patches of suitable habitat for G. p. gambiensis. (A) Landscape friction is the colored background, and habitat patches are delimited with blue contours. (B) The main tsetse belt predicted by MaxEnt for a sensitivity of 0.90 is in gray and habitat patches are shown as filled, red shapes. Contours and shapes of isolated patches were defined as 5-km radius buffers around pixels of habitat patches. The genetic distance of these patches to the main tsetse belt (reddish scale) was predicted by the AICc-best regression model along least-cost paths. Asterisks after cluster numbers represent the P values for the friction between the patches and the general habitat: (***) P = 10−3, (**) 10−3 ≤ P < 10−2, (*) 10−2 ≤ P < 5 10−2.

