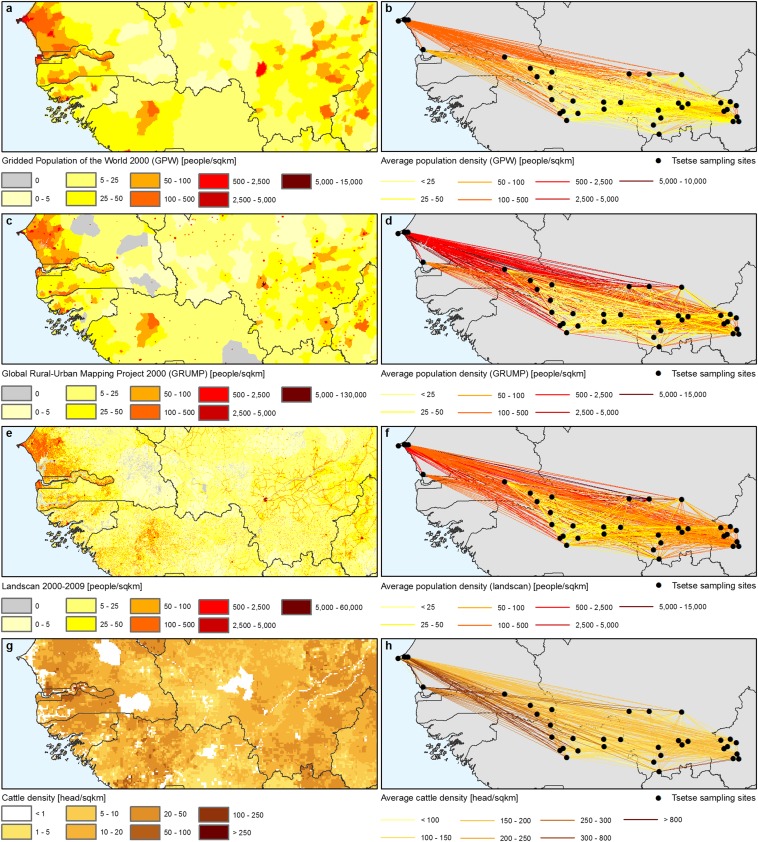
Fig. S3.
Population density datasets for genetics. (A) Human population density for the year 2000 (GPW) (59). (B) Average population density (GPW) between entomological sampling sites. (C) Human population density for the year 2000 (GRUMP) (60). (D) Average population density (GRUMP) between entomological sampling sites. (E) Human population density for the years 2000–2009 (Landscan) (61). (F) Average population density (Landscan) between entomological sampling sites. (G) Cattle density for the year 2000 (62). (H) Average cattle density between entomological sampling sites.

