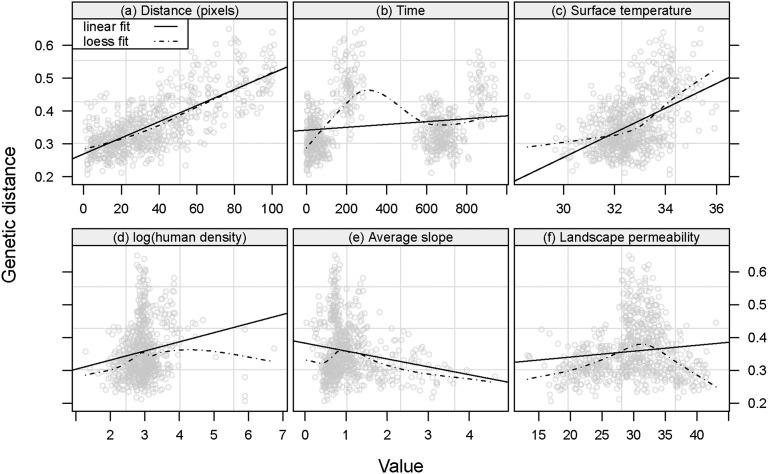
Fig. S4.
Relationship between the genetic distance and various environmental factors. The panels present the CSE (24) as a function of seven variables. (A) Number of pixels along each line connecting pairwise the entomological sampling sites along the direct paths. (B) Time between sampling dates (days). (C) Daytime land surface temperature (degrees Celsius). (D) Logarithm of human density (inhabitants per square kilometer). (E) Average slope. (F) Permeability index derived from Globcover 2006.

