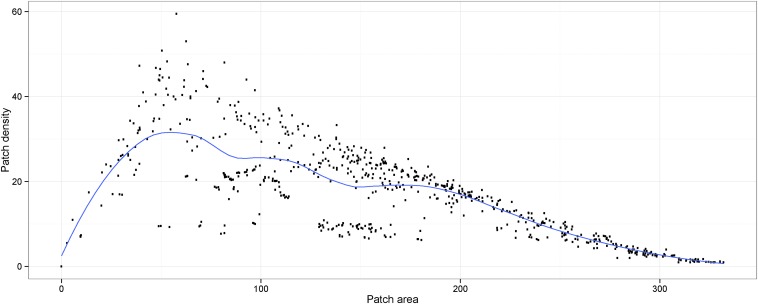
Fig. S5.
Nonlinear relationship between patch density and class area. This strongly skewed shape corresponds to a classical fragmentation process progressing from right to left (loess-smooth trend presented as a blue line). Points represent estimates for all of the pairs of sampled populations of G. p. gambiensis.

