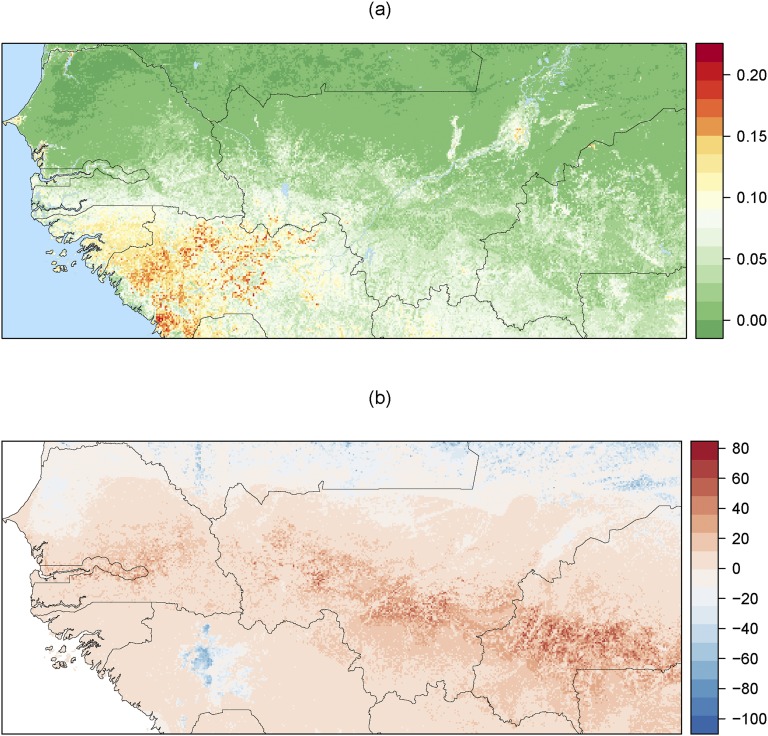
Fig. S7.
Uncertainty of MaxEnt predictions. (A) SD of suitability index across all 45 fitted models. (B) Multivariate environmental similarity surface plot for the environmental and occurrence data. Area in blue indicate zones of novel environmental condition where extrapolation should be interpreted with caution, whereas areas in red are the ones were the condition on the training data allow us to extrapolate accurately (in the training data range).

