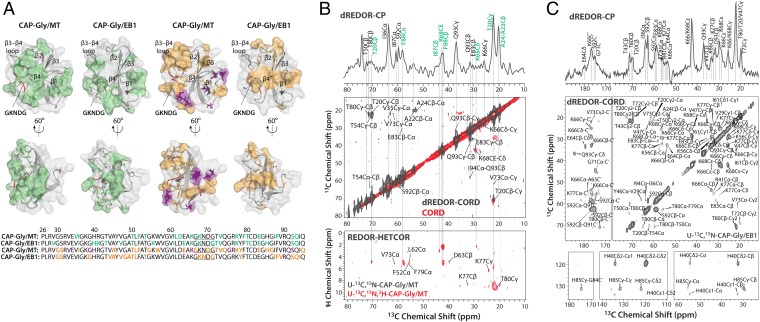
Fig. 4.
(A) Intermolecular interfaces of CAP-Gly with microtubules and end-binding protein EB1, derived from dREDOR (two Left panels) and chemical shift perturbations (two Right panels) in MAS NMR experiments, mapped onto the structure of CAP-Gly bound with MTs and in complex with EB1, respectively. The intermolecular interface of CAP-Gly with MT was obtained from dREDOR-based CPMAS and CORD experiments on U-13C,15N-CAP-Gly/MT (B, Top and Middle spectra, gray) and from CORD and 1H-13C-REDOR-HETCOR (35) experiments on U-13C,15N,2H-CAP-Gly/MT sample (B, Middle and Bottom spectra, red). Resonances obtained from both dREDOR-CORD and REDOR-HETCOR are labeled in green in B. (C) dREDOR-based CPMAS and CORD spectra of U-13C,15N-CAP-Gly/EB1. In A, the residues that belong to intermolecular interfaces of CAP-Gly with MT and EB1 are color coded as follows: with direct contacts in dREDOR- and HETCOR-based spectra (green); with large (> 1.0 ppm) and moderate (0.5–1.0 ppm) chemical shift perturbations (purple and orange, respectively). CAP-Gly residues at the interface with EB1 determined from chemical shift perturbations (23) are shown in orange. The primary sequence of CAP-Gly is depicted at the Bottom of A, and the residues are color coded as described above.

