Fig. 1.
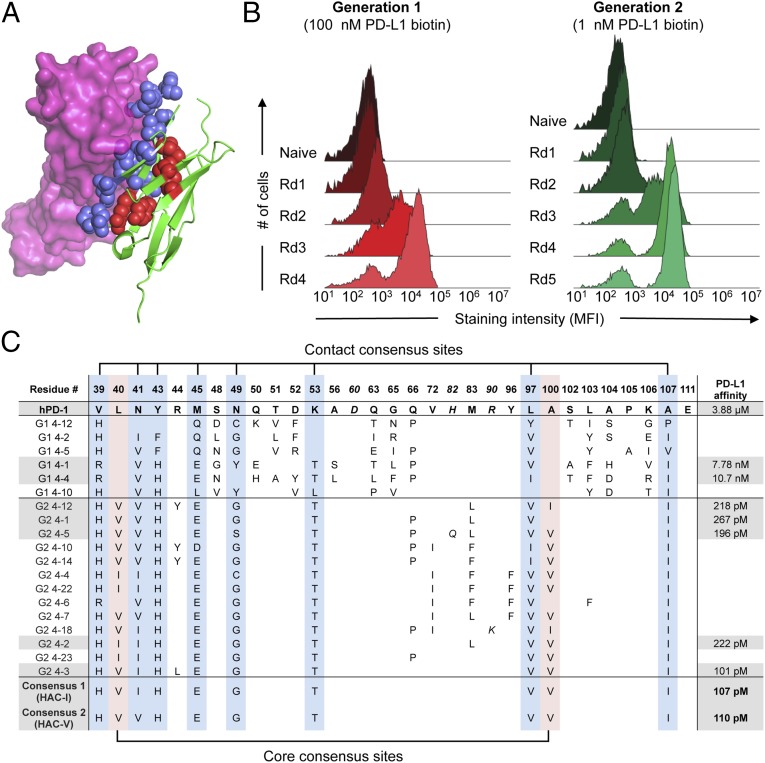
Directed evolution of high-affinity PD-1 with yeast surface display. (A) Model of hPD-1 (green) complexed with hPD-L1 (magenta) constructed by structural alignment of the mPD-1:hPD-L1 complex (PDB ID code 3BIK) with hPD-1 (PDB ID code 3RRQ). Randomized residues of PD-1 are depicted as blue spheres for PD-L1 contact residues and red spheres for core residues. (B) Histogram overlays assessing yeast hPD-L1 staining at each round of selection. For the first-generation selections (Left), all rounds were stained with 100 nM biotinylated hPD-L1. For the second-generation selections (Right), yeast were stained with 1 nM biotinylated hPD-L1. (C) Summary of sequences and hPD-L1 affinities for selected PD-1 variants. The position of each mutated position and the corresponding residue in wild-type PD-1 is indicated at the top of the table. Numbering reflects the amino acid position within the mature PD-1 protein after signal peptide cleavage. Italic font indicates mutations that occurred at nonrandomized sites. Blue column shading indicates PD-L1 contact positions that converged in the HAC consensus sequence, whereas red column shading indicates converging core positions. Gray shading denotes those sequences whose hPD-L1 affinities were determined by surface plasmon resonance (SPR).

