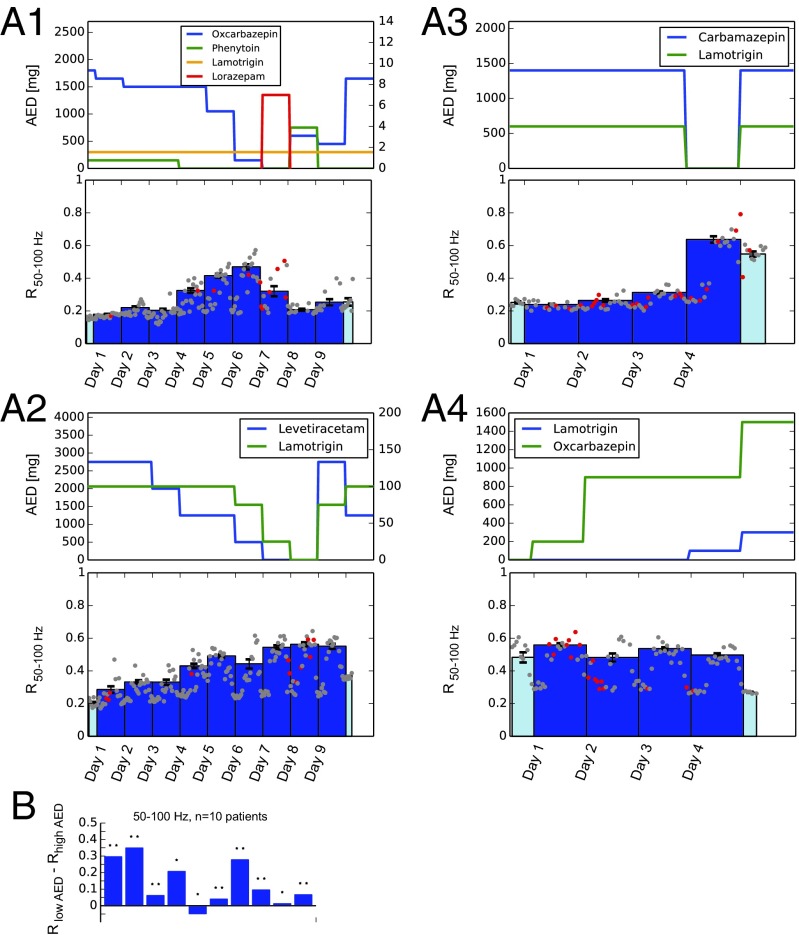
Fig. 2.
Intrinsic measures of synchronization track AED action during multiday recordings. (A, 1–4) Markers and level of medication of four patients. (Top) AED dosage. (Bottom) Changes in mean phase synchronization (R) for the frequency band 50–100 Hz. Dots correspond to 1-h measurements (red dots signify that at least one epileptic seizure occurred during this 1 h; gray dots signify no seizures). Daily averages were taken over the 12 highest hours of each day and are plotted as bars. Light colors were used when recordings did not encompass a full 24-h day. Error bars on each solid bar indicate SEM. Time on the x axis is labled in days, where each day starts at midnight. (B) Differences between full days of low and high AED levels for all 10 patients. *P ≤ 0.05, **P ≤ 0.001, two-sided paired sample t test. For complete time courses of the other high-frequency bands, see Fig. S2.

