Fig. 4.
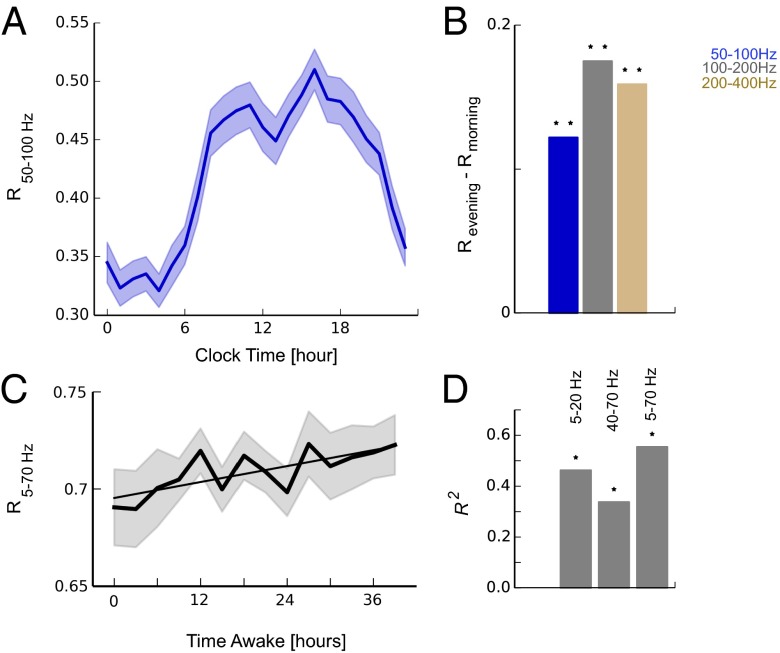
IEMs increase as a function of time awake. (A) Mean synchronization R from n = 10 patients during iEEG monitoring over a total of n = 70 d exhibits an increase during daytime hours and a decrease during the night (mean ± SEM) in different frequency bands. (B) The increase during day quantified as the difference between morning (hours 5–7) and evening hours (hours 17–19) of different frequency bands. *P ≤ 0.05, **P ≤ 0.001, two-sided paired sample t test. (C) Increase of R as a function of time awake during a 40-h period of total sleep deprivation where scalp EEGs were recorded every 3 h (n = 8 healthy subjects; straight line shows linear regression). (D) Summary results of linear regression analysis ( values, *P ≤ 0.05) of sleep deprivation EEG data; an increase in synchronization R was observed consistently in different frequency bands.

