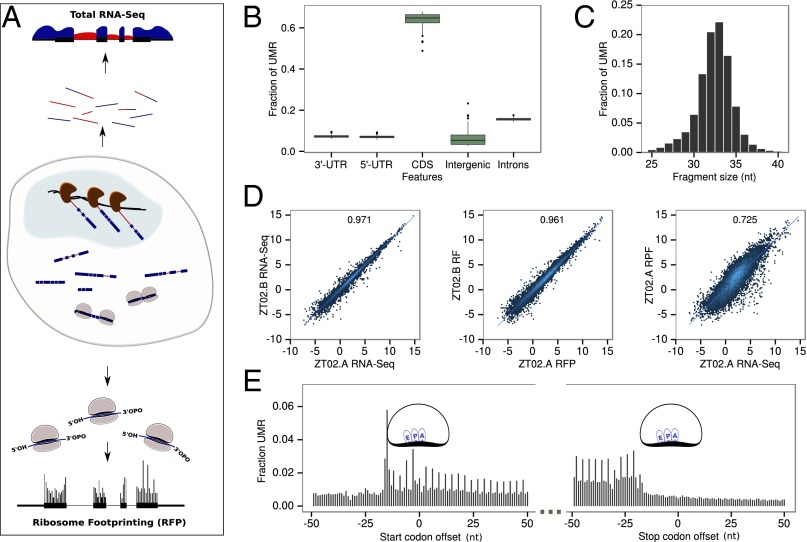
Fig. 1.
Ribosome profiling around the diurnal cycle in mouse liver. (A) Schematic representation of the experiment. Total mRNAs are directly sequenced (top) and ribosome loaded-mRNA are purified (ribosome footprinting) before sequencing (bottom). RNA-Seq from total RNA (genomic sequence is represented by a black line, surrounded by RNA-Seq signal) is quantified in intronic (red) and exonic (blue) regions to estimate pre-mRNA and mRNA levels. Ribosome density is quantified by modified ribosome profiling protocol. (B) The overall fraction of uniquely mapped reads (UMRs) of size between 28 and 34 bp up to one mismatch from the 84 Ribo-Seq samples in protein CDSs and nonprotein coding regions. (C) Size distribution of RFPs for UMR up to one mismatch. (D) Reproducibility of biological replicates. (Left) Log2 of total normalized counts (reads per kilobase per million, RPKM) for exonic RNA-Seq. (Middle) Ribo-Seq. (Right) Comparison of RPKM for Ribo-Seq and exonic RNA-Seq for each annotated protein coding gene (only UMR). R2 indicates Pearson correlation at the top of each panel. (E) Density of 5′ ends of 32-nt ribosome footprints at the starts and ends of ORFs shows three nucleotides periodicity. Positions of the related E, P, and A sites of the ribosomes are indicated.

