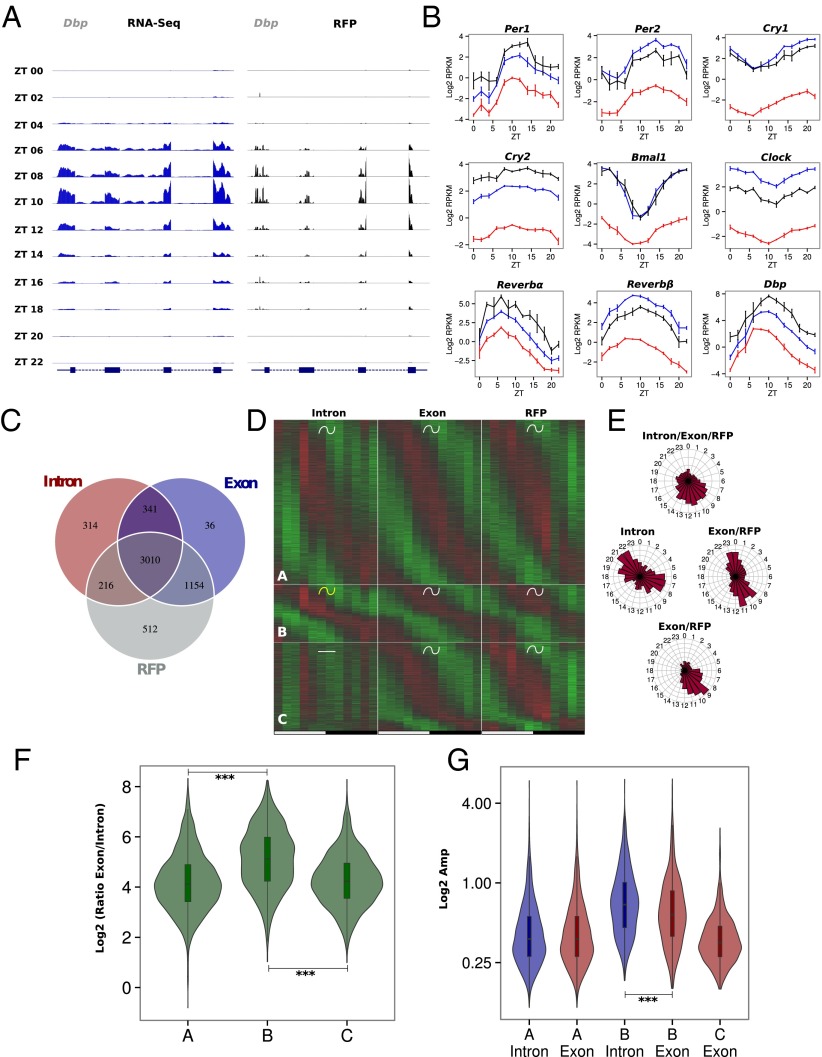
Fig. 2.
Rhythmic ribosome footprint signals are mainly driven by rhythmic mRNA accumulation. Model selection to assess rhythmicity is applied on WT ad libitum datasets combining intronic, exonic, and RFP signal. Harmonic regression is used with a period of 24 h and 12 h. Genes are assigned to one of the 29 models described in Fig. S5A. An arbitrary threshold of 0.4 is set on the BIC weight. Genes with log2 RPKM >0 at the exon and RFP levels are selected. (A) Exon RNA-Seq (Left) and RFP (Right) signals for the circadian clock-regulated Dbp gene. The two signals synchronously peak at ZT10. (B) Pre-mRNA (red), mRNA (blue), and RFP (black) signals in log2 RPKM for circadian clock core genes and clock-controlled genes. (C) Number of genes with rhythmic pre-mRNA, mRNA, and RFPs. The largest group shows rhythms on all three levels. (D) Three groups of genes showing identical mRNA and RFP rhythms. Standardized relative expression is indicated in green (low) and red (high). White and black boxes represent light and dark periods, respectively. (E) Phase distribution of the three groups described in D. (F) Distribution of mRNA (Exon)/pre-mRNA (Intron) ratios for the three groups of genes. An increased ratio suggested a more stable mRNA and longer half-life. A Welch′s t test indicates that this ratio is significantly higher in group B compare with groups A (P = 1⋅10−62) and C (P = 1⋅10−49). (G) Distribution of pre-mRNA (blue) and mRNA (red) amplitudes for the three groups. Group B harbors decreased amplitude in exons compare with introns (paired t test: P = 5⋅10−13) as a consequence of long half-lived transcripts, despite a general trend for higher amplitude.

