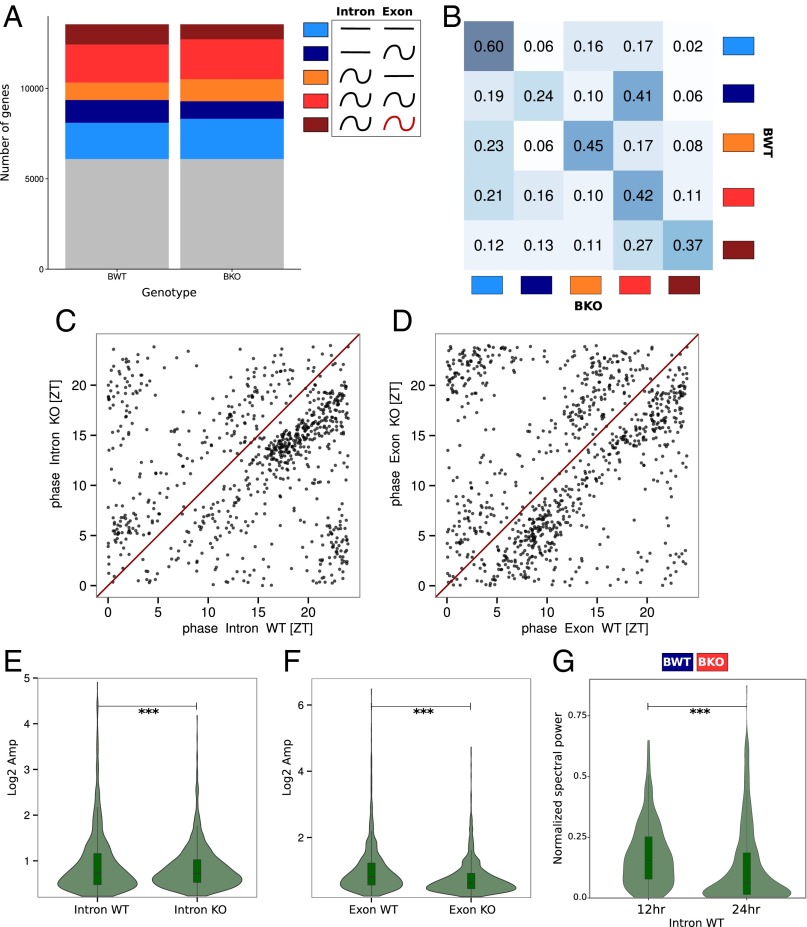
Fig. 3.
Effects of Bmal1 deletion on rhythmic mRNA accumulation. Model selection to assess rhythmicity is applied on Bmal1 WT and KO RF dataset combining intronic, exonic, and RFP signal. Harmonic regression is used with a period of 24 h. Genes are assigned to one of the 877 models generated by the six conditions. A threshold of 0.1 is set on the BIC weight. Genes with log2 RPKM >0 at the exon and RFP levels in WT condition are selected. (A) Genes are clustered in the six groups depending of the model they were assigned and grouped in function of their rhythmic pattern at the intronic and exonic level: gray, genes not assigned in any group; light blue, constant pre-mRNA and mRNA levels; dark blue, constant pre-mRNA and rhythmic mRNA; orange, rhythmic pre-mRNA and constant mRNA; red, rhythmic pre-mRNA and mRNA; brown, rhythmic pre-mRNA and mRNA with different rhythmic parameters. (B) Fraction of genes belonging in one of the five clusters in KO compared with WT mice. Intensity of the blue color in each box represents the conservation degree of behavior of the genes between WT and KO, with darkest blue corresponding to higher conservation. (C) Phase distribution of rhythmic pre-mRNA in WT and KO mice. (D) Phase distribution of rhythmic mRNA in WT and KO mice. (E) Distribution of pre-mRNA amplitudes in WT and KO mice. KO mice present slightly increased amplitude compare with WT (paired t test: P = 1⋅10−4). (F) Distribution of mRNA amplitudes in WT and KO mice. KO mice present decreased amplitude compare with WT (paired t test: P = 1⋅10−32). (G) Fourier transform is applied for genes belonging to the dark blue cluster in WT and red in KO mice. Distribution of amplitude density for the 24-h and 12-h harmonics are computed for WT animals. The high component of the 12-h harmonic indicates a predominantly 12-h rhythmic pre-mRNA level (paired t test: P = 2⋅10−6).

