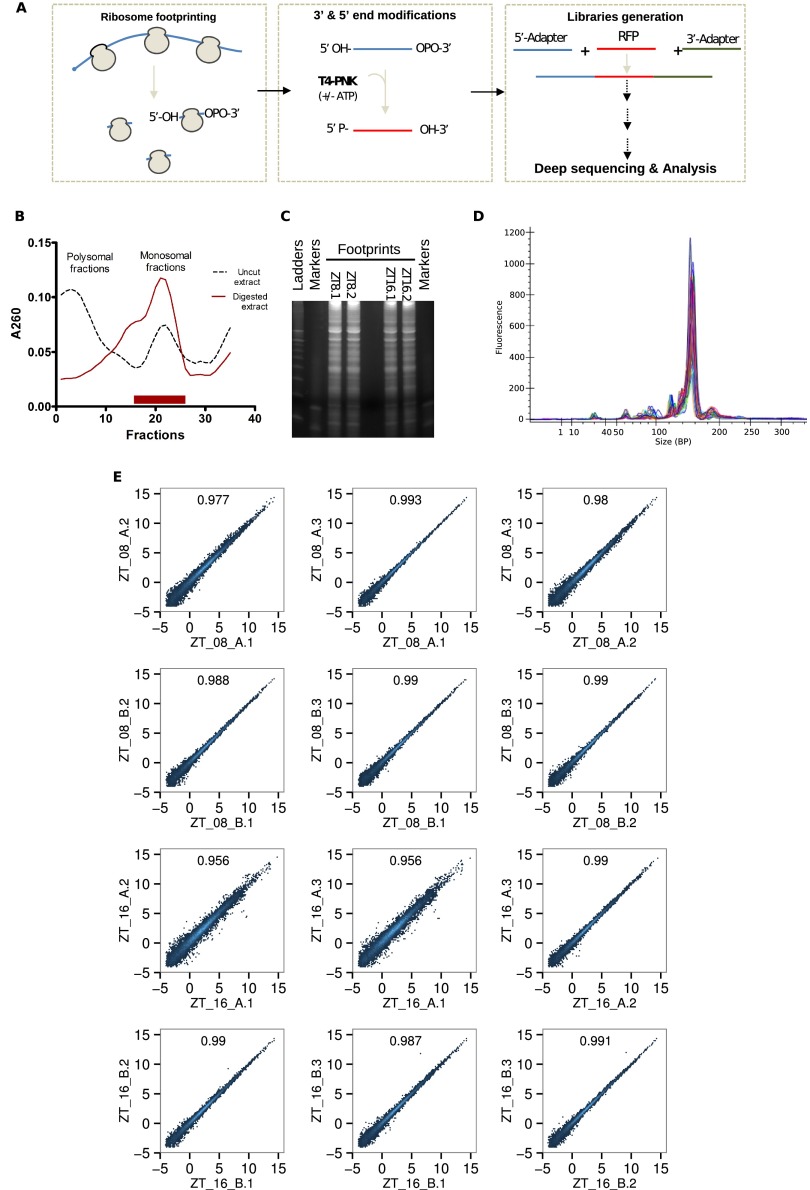
Fig. S1.
Technical validation of ribosome profiling experiments. (A) Simplified representation of the modified ribosome profiling method. RNase I digestion leaves a 5′-OH and a 3′-cyclophosphate. T4 polynucleotide kinase treatment performed in the absence of ATP converts the 3′-cyclophosphate into a 3′-OH whereas phosphorylating the 5′-OH ends in presence of ATP. Libraries are then generated as described in Materials and Methods. (B) Example of 260-nm optical density profile from sucrose gradient fractions. RNase I-digested lysates (red line) harbor clear monosome enrichment, whereas untreated controls (dark dashes) exhibit a standard polysome-enriched profile. Monosomal RNA was then extracted from fractions delimited with a red bar. (C) Extracted RNAs were resolved on 15% TBE-urea-PAGEs to select 28- to 36-nt-long RNA fragments. (D) Homogenous size distribution of libraries with a strong and sharp library peak at the expected size (∼150 bp). (E) Technical reproducibility of technical replicates for each individual gene (log2 RPKM). R2 indicates Pearson correlation at the top of each panel. Four samples (two per time point) were treated as described before. Then, fragmented RNAs were split, resolved on three distinct 15% TBE-urea-PAGEs, and analyzed as described in Materials and Methods.

