Fig. S5.
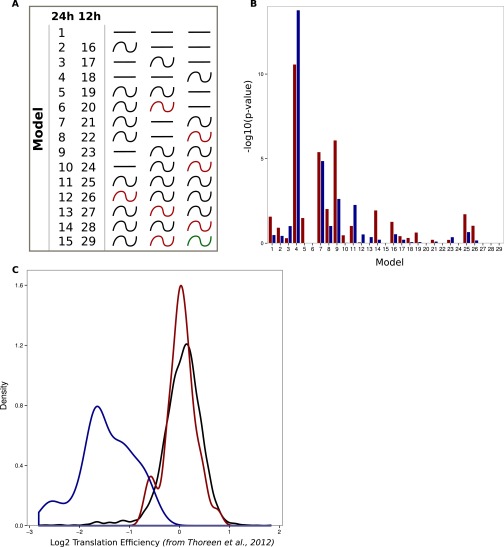
Enrichment for TOP and TISU genes in model presenting rhythmic translation efficiency. (A) Schematic representation of the 29 possible rhythmic patterns. Models 2–15 and 16–29 classify genes following a 24- or 12-h period, respectively. Depending on the pattern, red-colored waves represent different rhythmic parameters compared with the black ones. (B) Genes harboring TISU (red bars) and TOP (blue bars) motif are predominantly found in models describing rhythmic translation from constantly expressed mRNAs (models 4, 7, and 8). P values were calculated using a hypergeometric test. (C) Torin 1-induced changes in translation efficiency (32) is observed for genes with TOP (blue) and TISU (red) motifs in Fig. 4. Black line represents all genes. Genes with TOP motifs, but not TISU, are responsive to mTOR inhibition.

