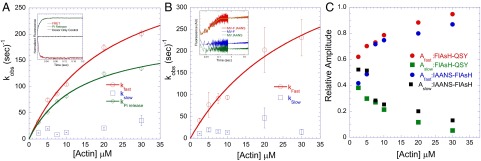
Fig. 3.
Kinetics of the power stroke. The kinetics of lever arm swing during the power stroke were measured by sequential mix single-turnover experiments (final concentrations: 0.15–0.25 µM MV, 0.1–0.2 µM ATP, and varying actin concentrations). (A) In the MV-F.QSY construct we observed a biphasic decrease in FlAsH fluorescence [Inset: representative traces of the FRET signal (red, kFast = 269 ± 18⋅s−1) and phosphate release signal (green, kobs = 97 ± 1⋅s−1) at 30 µM actin]. (B) In the MV-F.IAANS construct we observed a biphasic increase in FlAsH fluorescence (Inset: representative traces at 10 µM actin). In both constructs the observed rate of the fast phase increased as a function of actin concentration, but the slow phase remained unchanged. For the FlAsH–QSY construct in A, the maximum rate of the fast phase was 352 ± 33⋅s−1, and the average rate of the slow phase was 18 ± 9⋅s−1. For the IAANS–FlAsH construct in B, the maximum rate of the fast phase was 493 ± 119⋅s−1, and the average rate of the slow phase was 20 ± 13⋅s−1. The observed rate of phosphate release was also measured with the MV-F.QSY construct and was plotted as a function of actin concentration in A (same concentrations as above and 4.5 µM PBP). The hyperbolic fit of the data allowed determination of the phosphate release rate constant (201 ± 11⋅s−1). (C) The relative amplitudes of the fast and slow phases in the FRET signal were plotted as a function of actin concentration.

